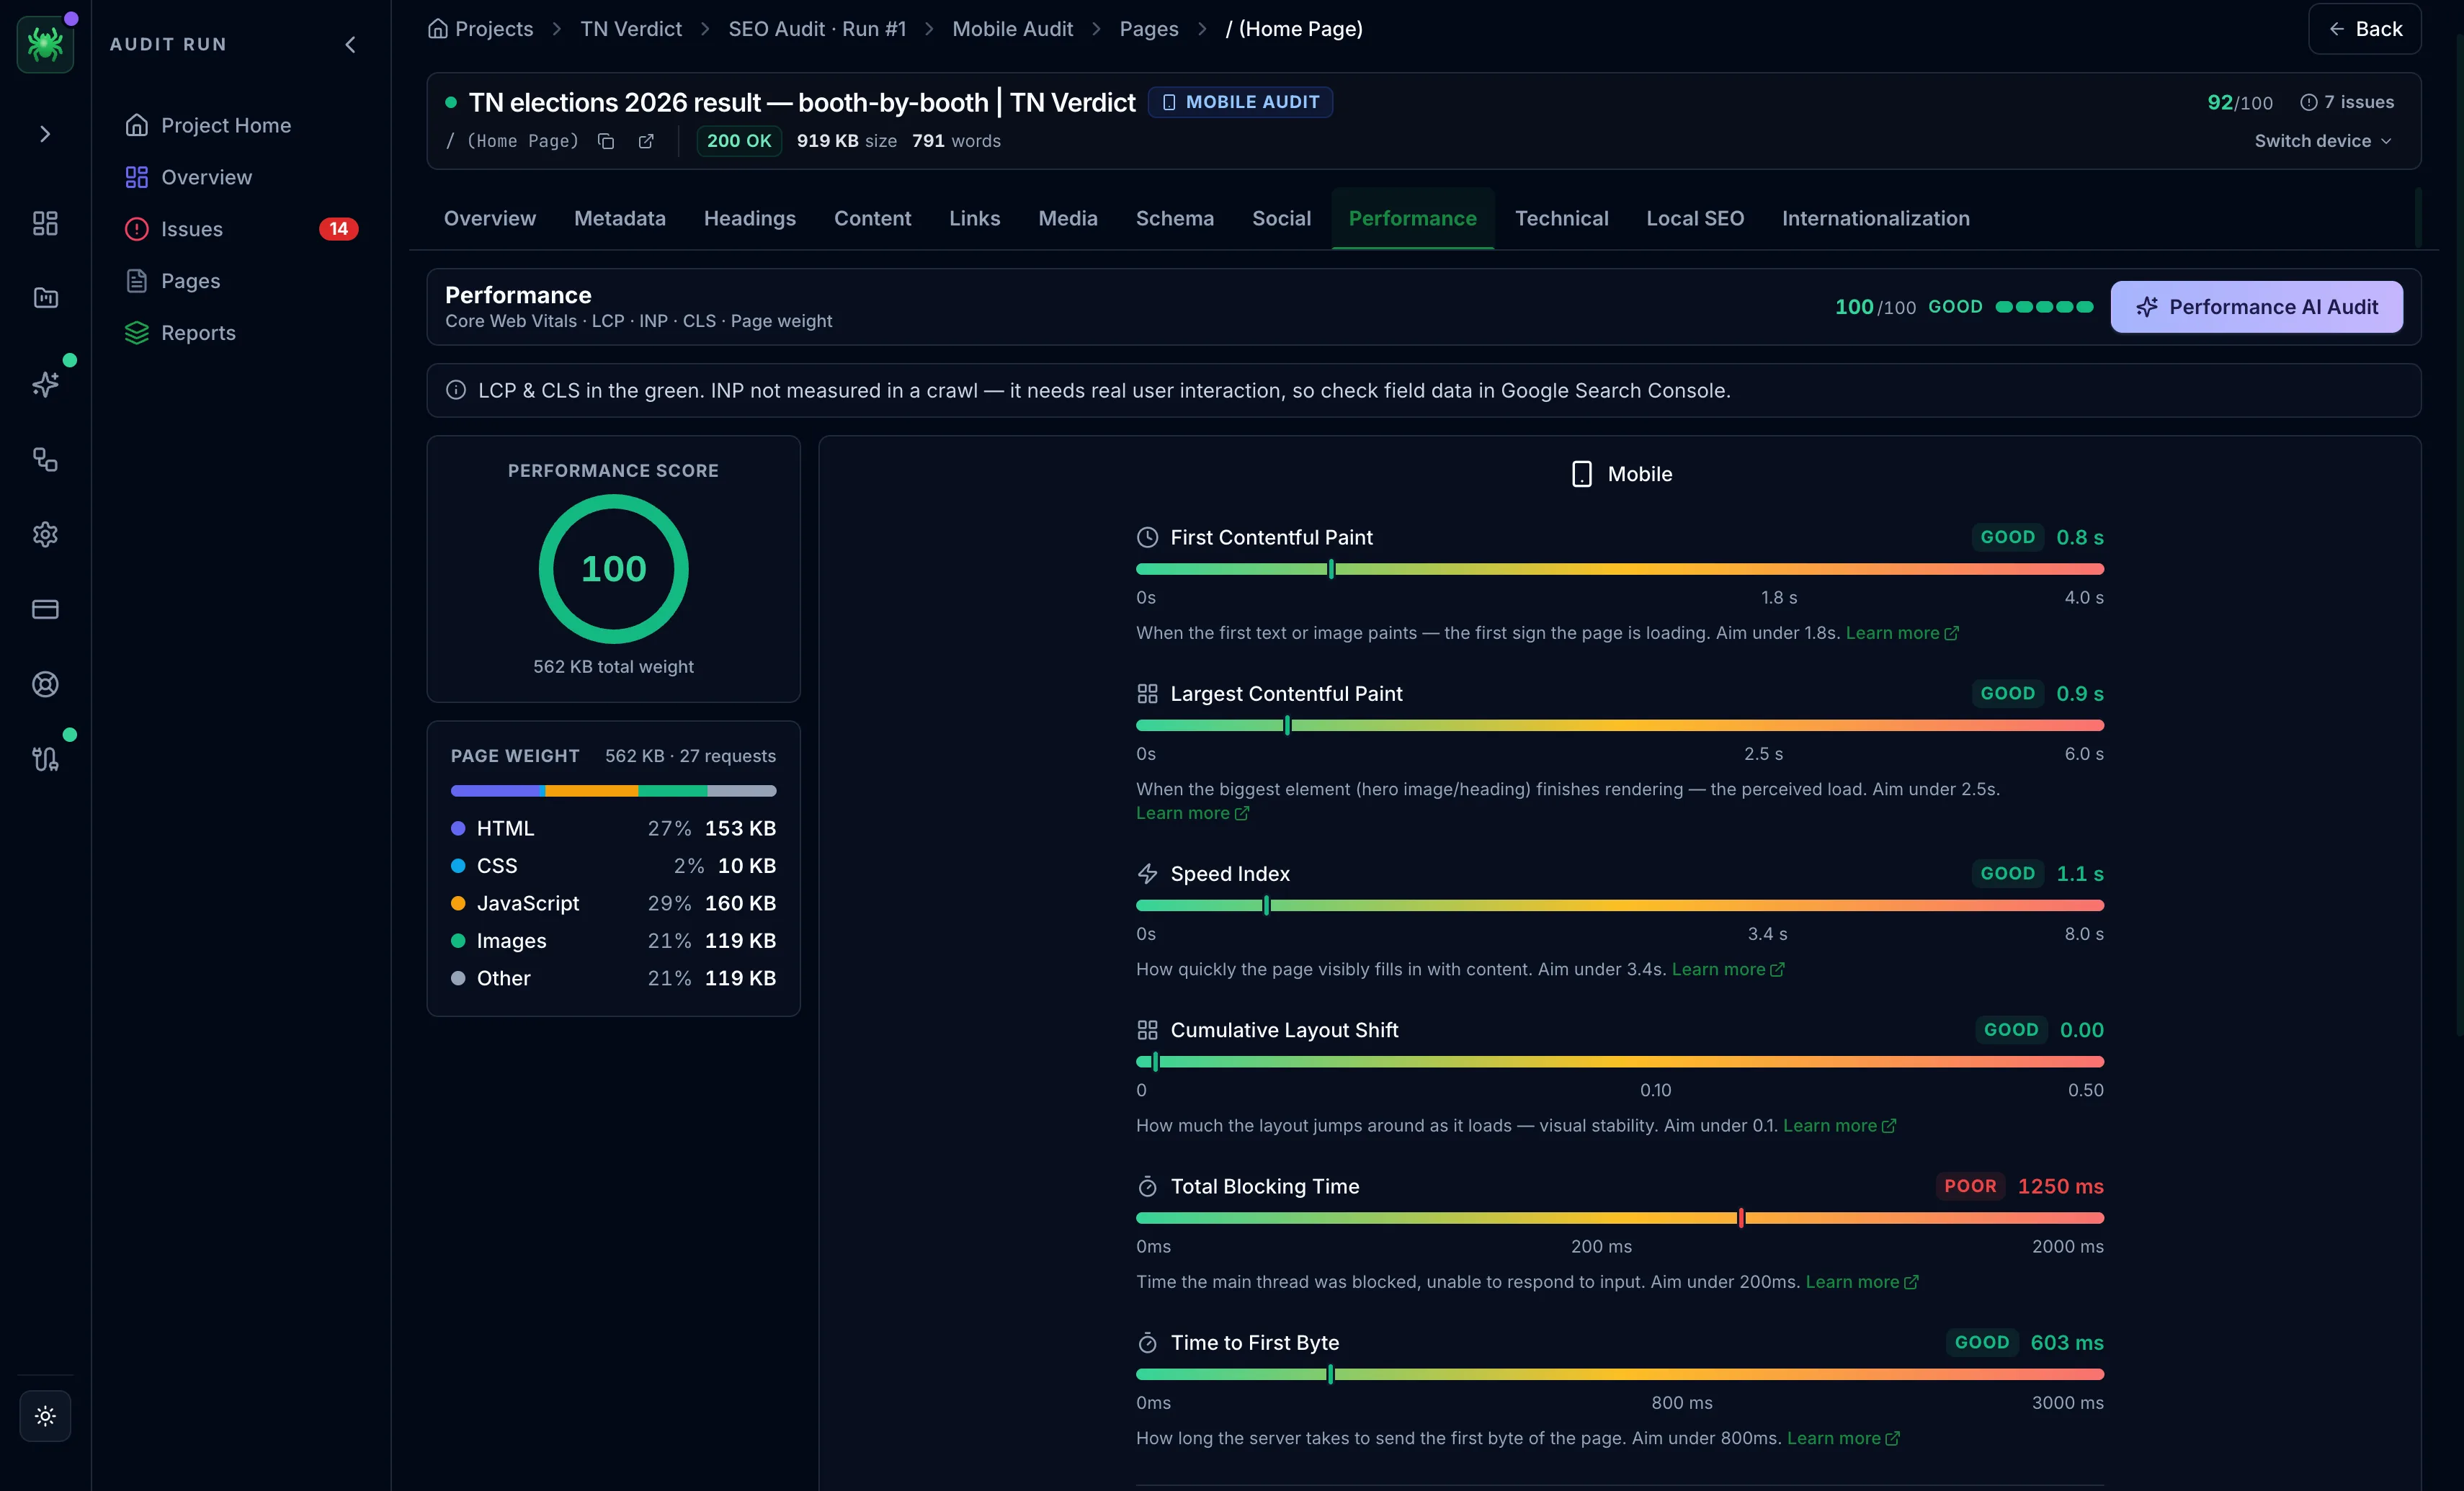
Performance tab
The Performance tab reports Core Web Vitals, page weight, and the resources slowing a page down.
The Performance tab reports how fast a page loads and what is holding it back. It shows Core Web Vitals plus a full breakdown of page weight and the specific resources that cost load time. Speed is both a ranking signal and a conversion factor. This tab pairs the graded metrics with the named offenders behind them, so the fix is concrete rather than a number to chase.
These metrics come from the crawl's own browser render, not real-user data. INP cannot be measured in a crawl because it needs a real user interaction to exist. The tab never claims an INP pass, and for INP it points to field data in Search Console. When a page could not be browser-rendered (for example, blocked by a bot wall), an HTTP-fallback banner explains that Core Web Vitals, page weight, and the screenshot are unavailable. The HTML-level audit is unaffected.
Score and Core Web Vitals
A performance score ring sits beside the Core Web Vitals bars — LCP, INP, CLS, FCP, TTFB, TBT, and Speed Index. Each is graded against Google's current thresholds from the measured value. A verdict banner above summarizes the result. It names which of LCP, INP, and CLS actually passed and calls out any it could not measure rather than counting them as passes.
Each metric is rated Good, OK (needs improvement), or Poor at these boundaries:
| Metric | Good | Needs improvement | Poor | What it measures |
|---|---|---|---|---|
| LCP | ≤ 2.5 s | 2.5–4.0 s | > 4.0 s | Time to render the largest element — perceived load speed |
| INP | ≤ 200 ms | 200–500 ms | > 500 ms | Responsiveness to interaction (field data only) |
| CLS | ≤ 0.1 | 0.1–0.25 | > 0.25 | Visual stability — how much layout shifts |
| FCP | ≤ 1.8 s | 1.8–3.0 s | > 3.0 s | Time to first visible content |
| TTFB | ≤ 800 ms | 800–1800 ms | > 1800 ms | Server response time |
| TBT | ≤ 200 ms | 200–600 ms | > 600 ms | Main-thread blocking during load (lab proxy for INP) |
LCP, INP, and CLS are the three Google ranks on. The rest are diagnostic. Because INP needs a real interaction, it shows in the bars but is sourced from field data, not the crawl.
Page weight
A page weight breakdown shows a stacked proportion bar and per-type rows — HTML, CSS, JavaScript, Images, Fonts, and Other. Each row shows its share and size, plus the total transferred bytes and request count. This is the real page weight, not the HTML document size shown in the page header, so it reflects what actually costs load time. When some responses could not be measured, the total is marked as a lower bound.
Resource insights and offenders
Resource insights summarize the delivery signals behind the score, each color-coded good, warning, or bad:
- Render-blocking — the count of blocking scripts and stylesheets (a warning above zero, bad above four)
- CDN — whether the document and its assets are served from a CDN, with the detected provider and asset coverage percentage
- HTTP version — flagged when still on HTTP/1.1
- Cache hit-rate — a warning below 60%
- Uncompressed text — the file count and wasted bytes when compression is missing
Resource offenders name the specific files to fix: the heaviest resources, oversized images, and slowest requests. Each is a short list of URLs with their size or timing.
On paid tiers, the Performance AI Audit turns the score, weight, and offenders into a prioritized list of the highest-impact fixes.
Chase the offenders before the score. A single oversized hero image or a render-blocking script usually explains a poor LCP. Fixing it moves the metric far more than incremental tuning.