
Reports & dashboards
Read your crawl — the project dashboard, the Visualizer, audit comparison, and the per-page report with a tab for every area of SEO.
Once a crawl finishes, Spider gives you several ways to read the results. They range from a site-wide overview down to a single page, and across runs over time.
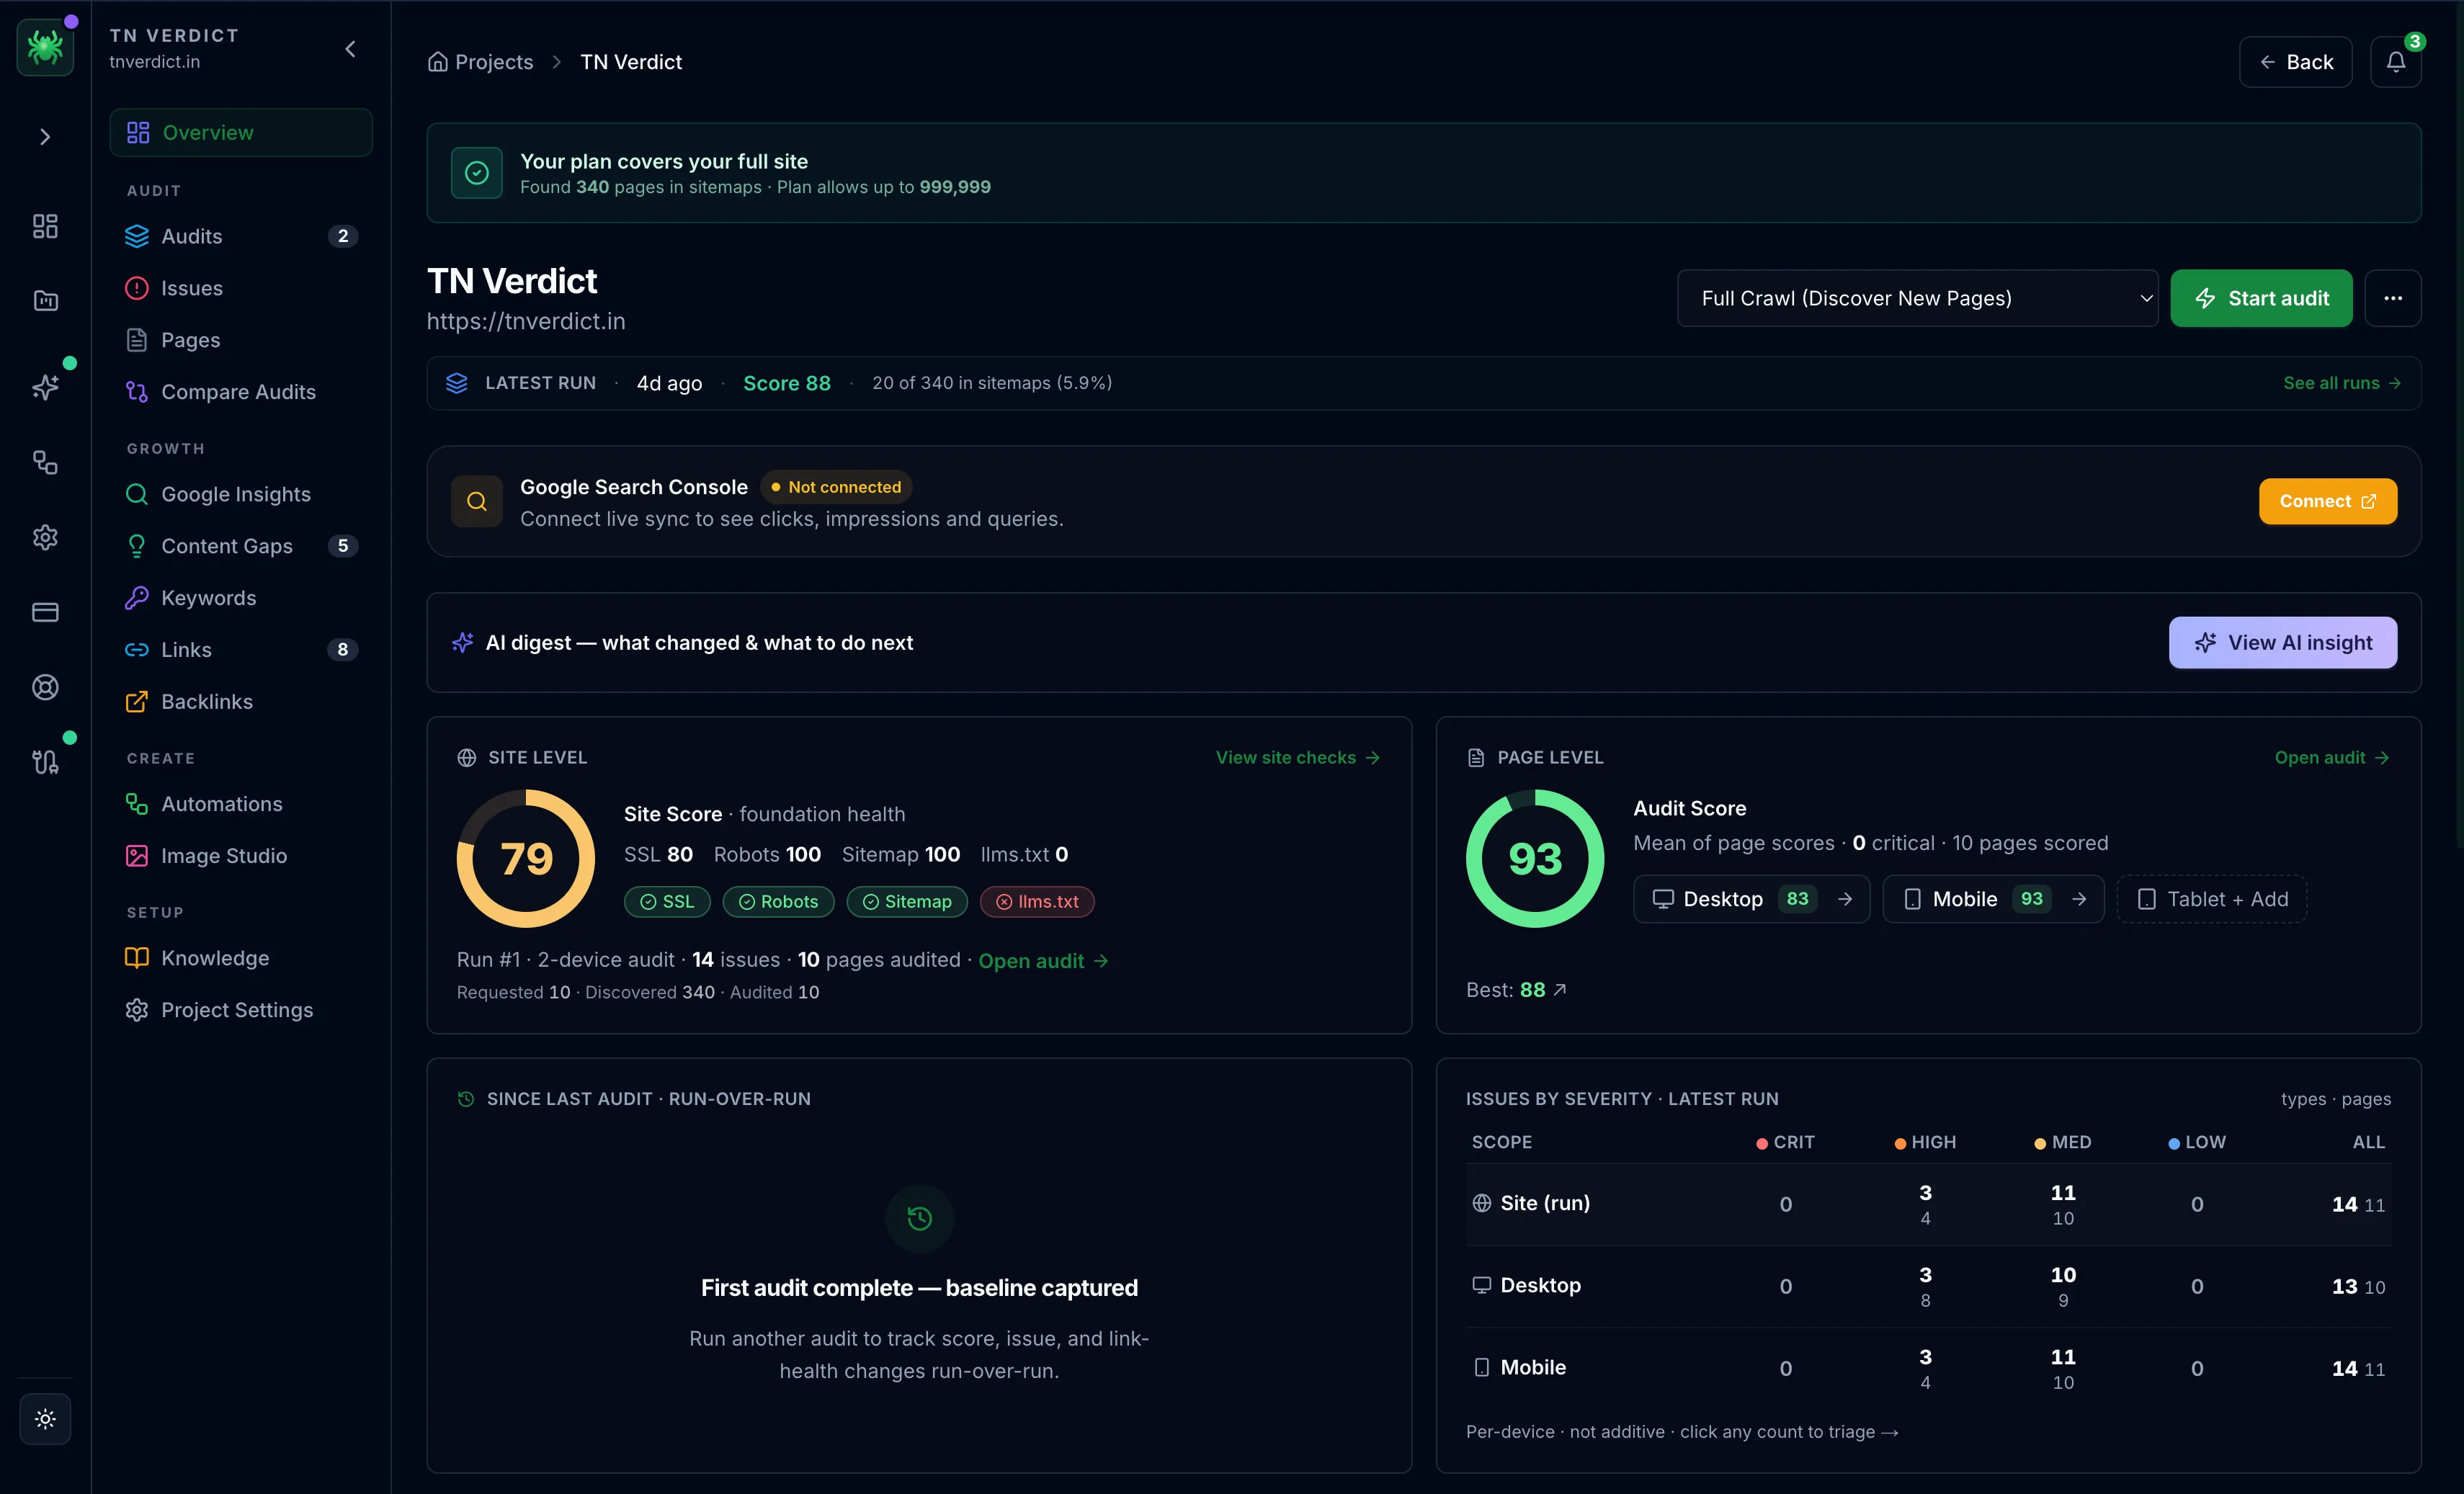
Project dashboard
The project dashboard is the site-wide overview. It shows the latest run's issue breakdown by severity and category, device-by-device scores, site-health signals, and the trend across previous crawls. It's the fastest way to see what's burning and what to fix first.
The Visualizer
The Visualizer maps your site as an interactive graph, color-coded by depth, status, or issues, and grouped into clusters you can drill into. It's the fastest way to spot orphan pages, over-deep sections, and broken-link clusters at a glance. See The Visualizer for the full feature set.
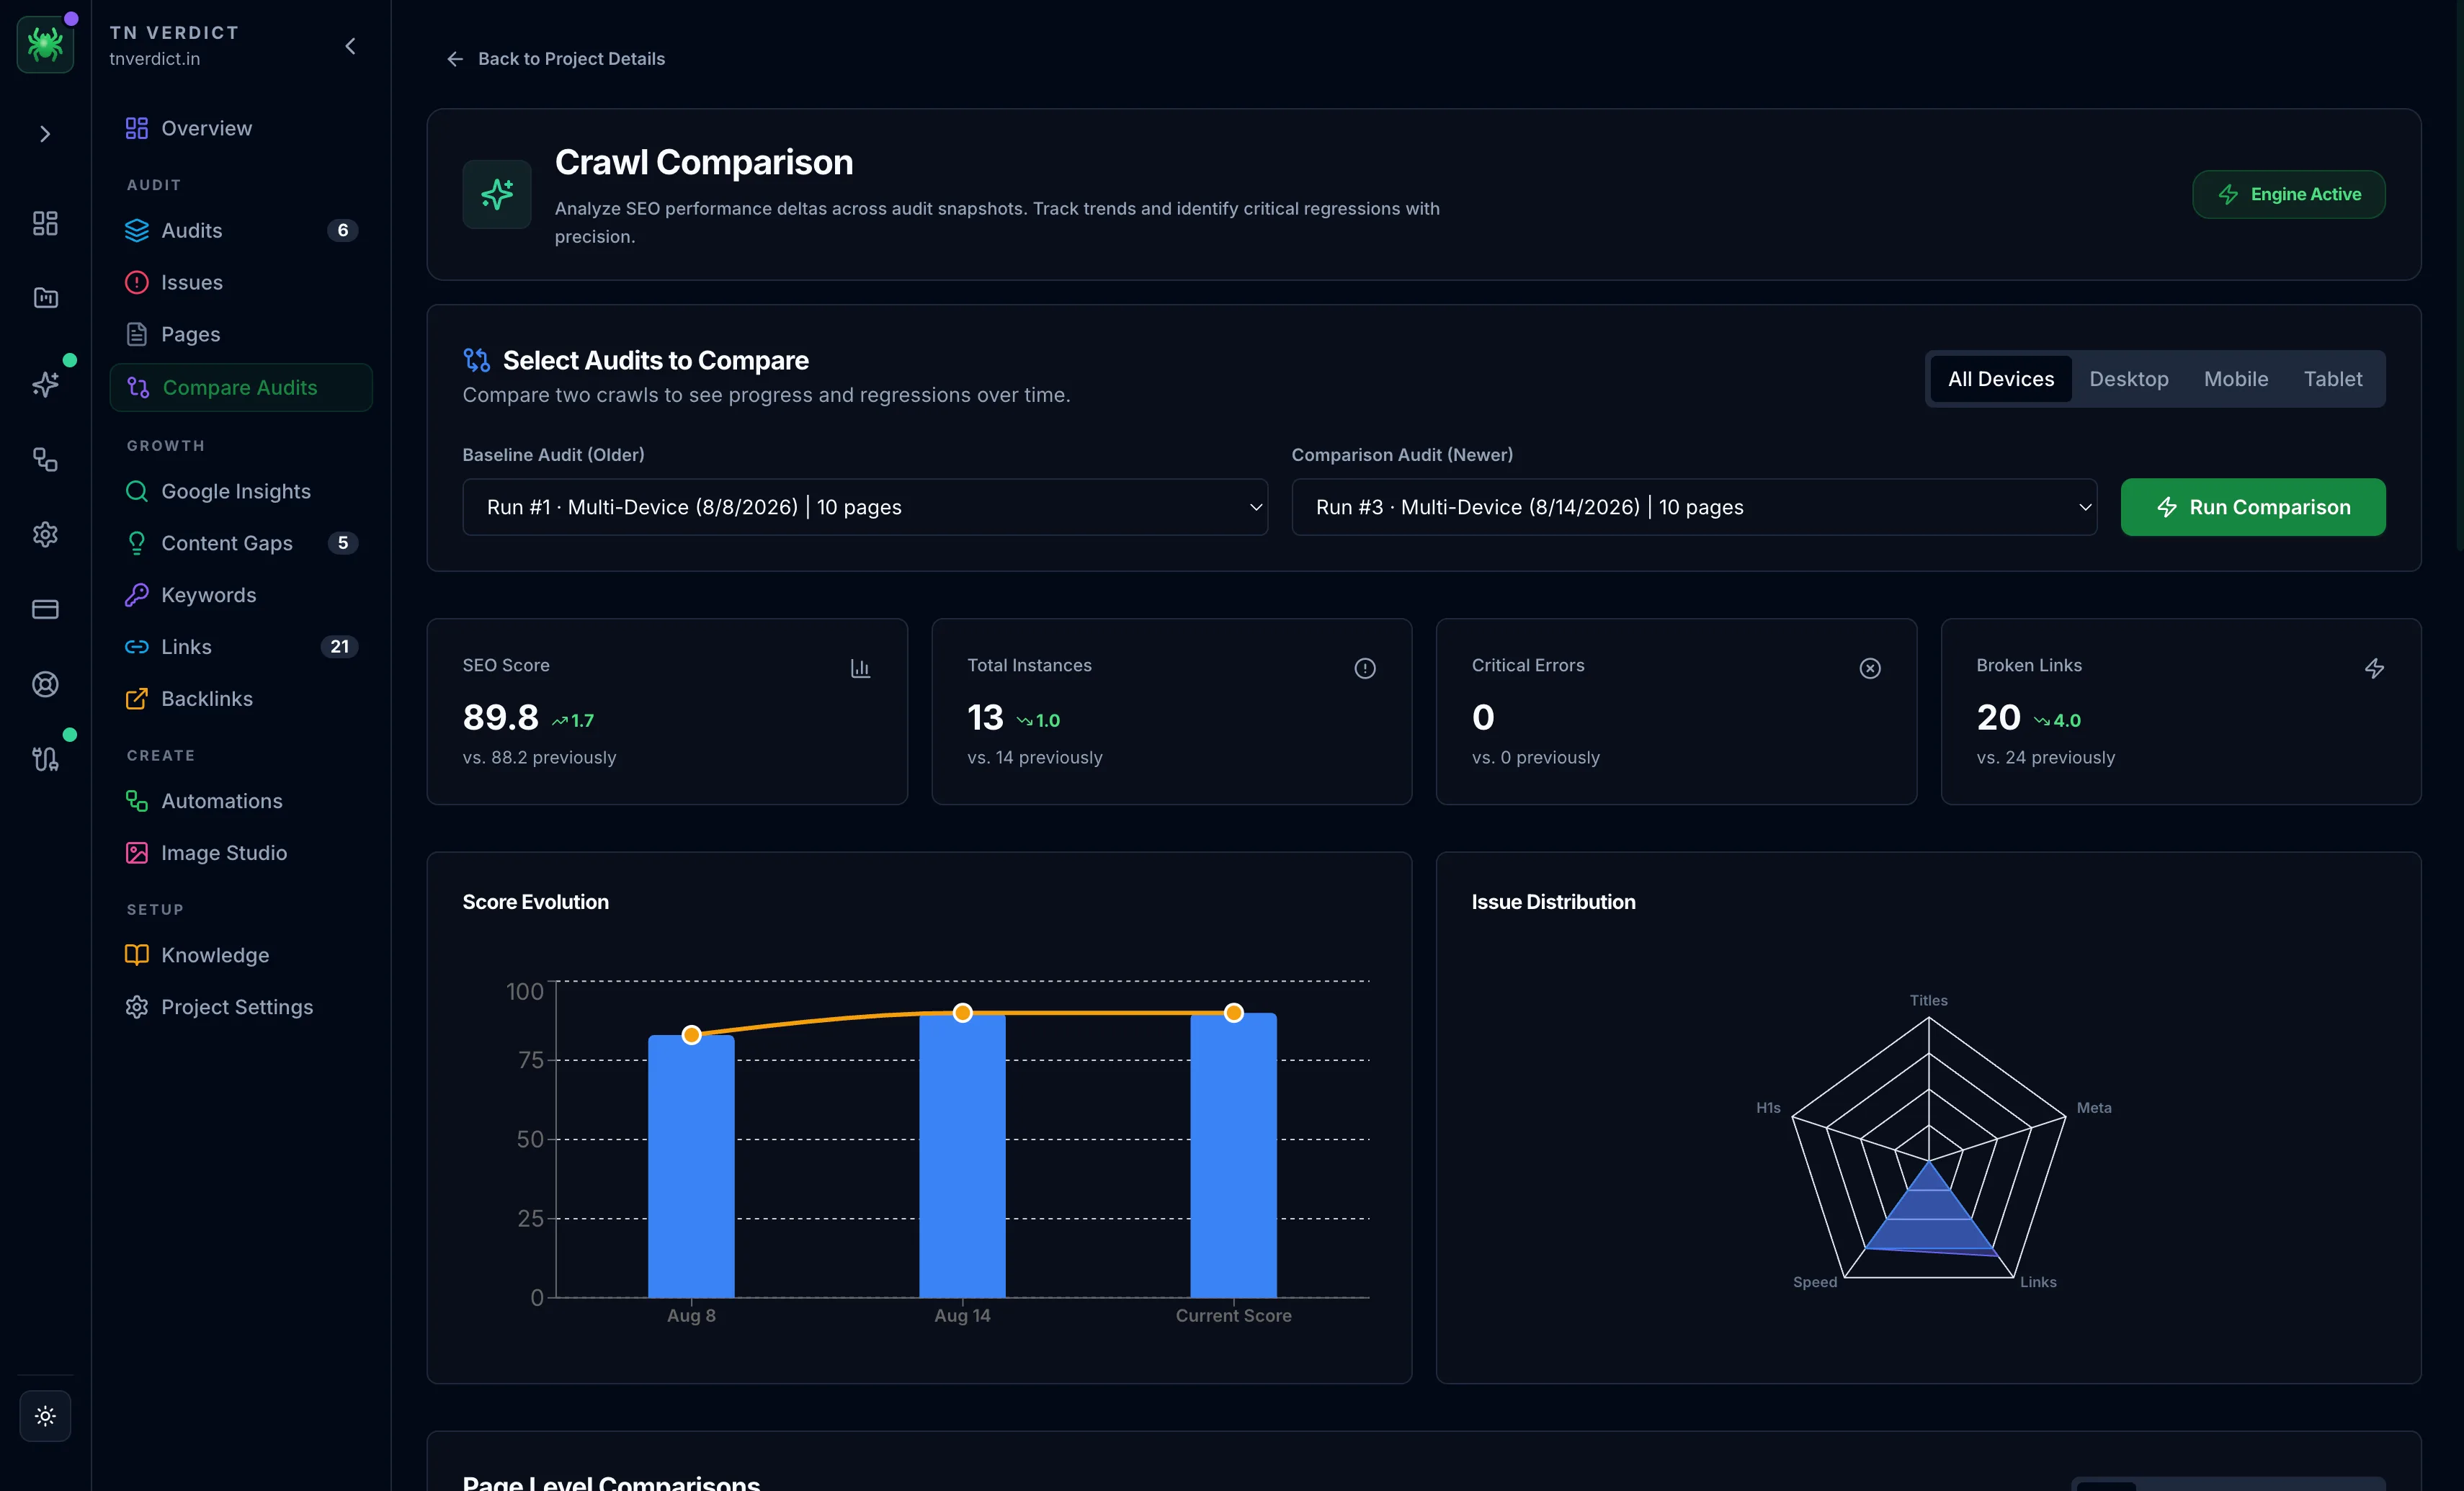
Comparing audits
Compare two crawls to see exactly what changed. It reports issues fixed versus newly introduced, and score and page-count deltas. Run it after shipping fixes to confirm they worked, or on a schedule to catch regressions.
The per-page report
Open any crawled URL to see its full report. A sticky SEO score and issue count sit in the header. The detail is split into tabs, one per area of SEO. Every tab carries a one-click AI Audit on paid tiers. Page issues appear on the Overview tab rather than a tab of their own.
Overview tab
The Overview tab summarizes a single page — its SEO score, a Google search preview, category scores, what's working, and the full issue list.
Metadata tab
The Metadata tab audits the title, description, canonical, robots directives, hreflang, and the technical tags behind how a page is indexed.
Headings tab
The Headings tab validates the H1–H6 outline, flags structural problems, and can fix the structure with AI.
Content tab
The Content tab measures quality, keywords, and authority across three sub-tabs, with intent and industry detection.
Links tab
The Links tab reports link health, broken and unreachable links, weak anchors, and a filterable table of every link on the page.
Media tab
The Media tab audits images and video — alt text, formats, dimensions, CDN delivery, and VideoObject schema.
Schema tab
The Schema tab detects structured data, validates it, checks rich-result eligibility, and visualizes the entity graph.
Social tab
The Social tab validates Open Graph, Twitter/X, and LinkedIn tags and previews how the page looks when shared.
Performance tab
The Performance tab reports Core Web Vitals, page weight, and the resources slowing a page down.
Technical tab
The Technical tab checks HTTPS, robots, canonical, security headers, cloaking, and the detected technology stack.
Local SEO tab
The Local SEO tab checks NAP consistency, LocalBusiness schema, map integration, and location signals — for pages that serve a physical area.
Internationalization tab
The Internationalization tab validates hreflang — language and region coverage, self-reference, x-default, and the variant list.
Start with errors on your highest-traffic pages. Fixing one template usually clears the same issue across hundreds of URLs at once.