
PageSpeed
The PageSpeed panel reports Core Web Vitals from three sources — live in-browser, lab, and real-user field data — plus resource hints.
The PageSpeed panel (labelled Speed) reports Core Web Vitals and performance. It splits the data across four sub-tabs, so you can compare the numbers a lab, a browser, and real users each report side by side. Core Web Vitals are a confirmed ranking factor. More importantly, they measure the load and interaction experience that decides whether a visitor stays. The three data sources answer different questions: what one test just measured, what real users experience, and what a controlled synthetic run finds.
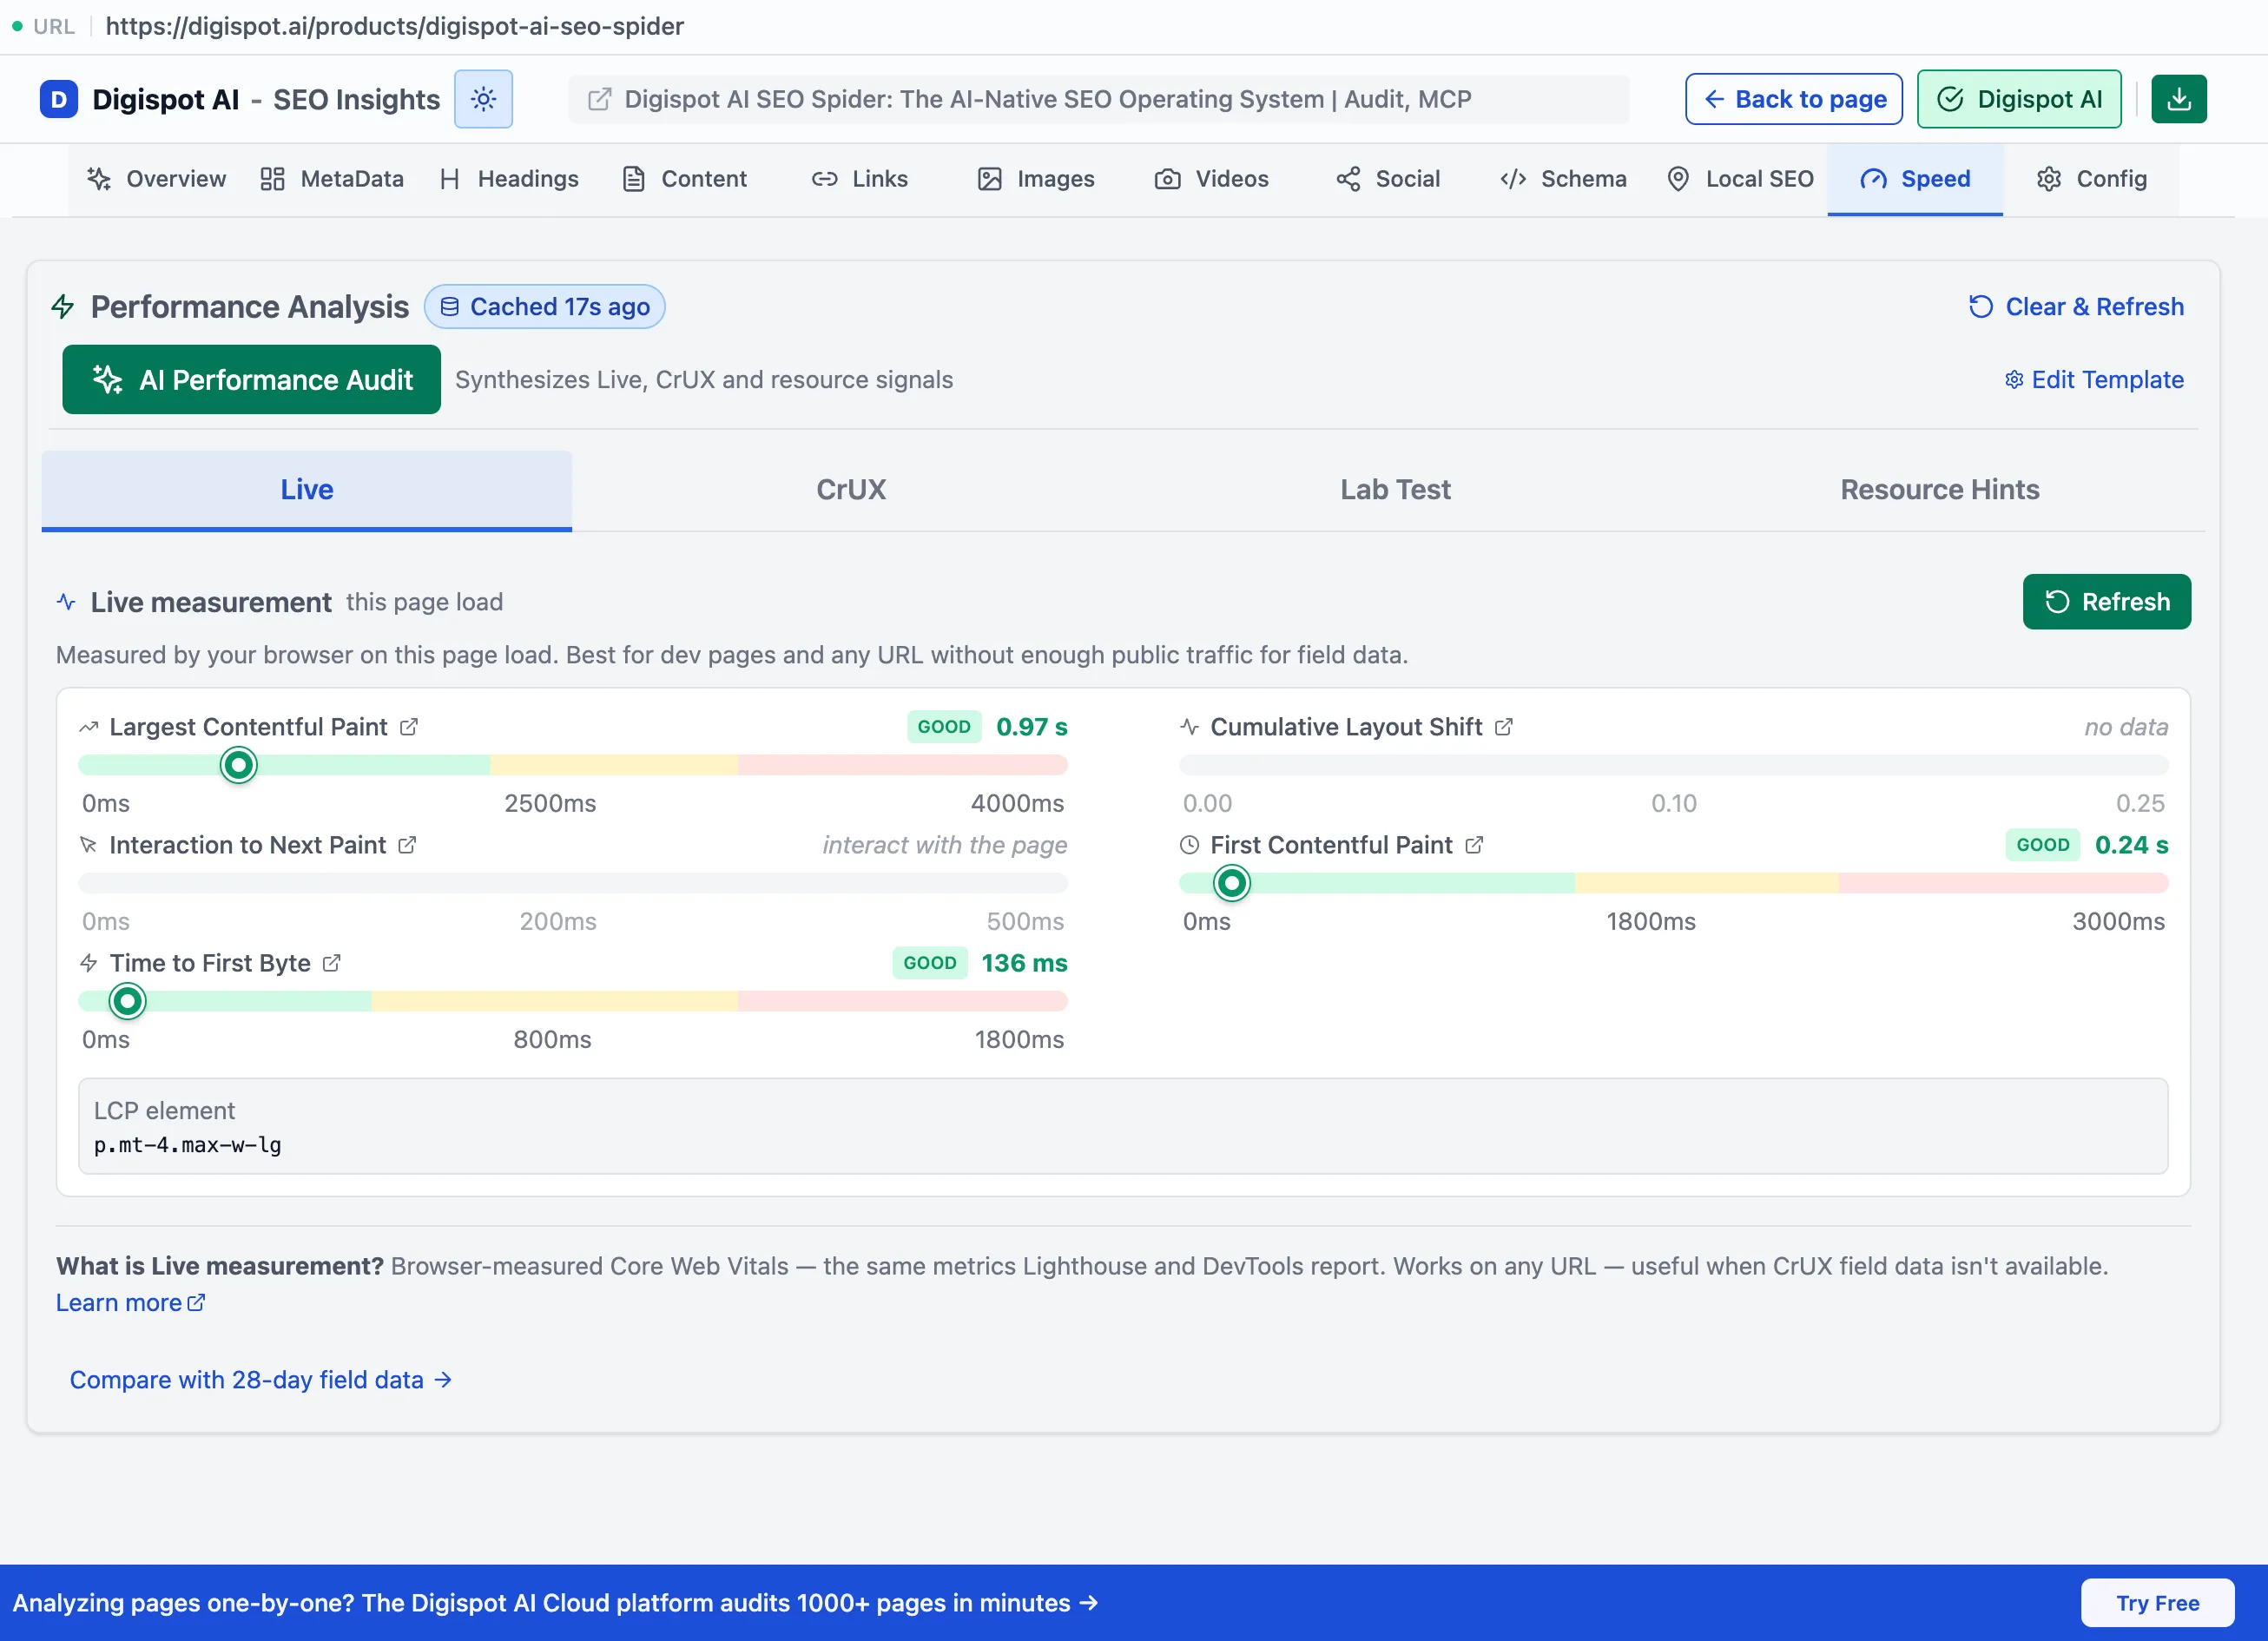
Live
The default sub-tab measures Core Web Vitals live in the browser using the Performance API: FCP, LCP, INP, CLS, and TTFB. It works on any URL. Measuring the current page needs one-time access to the site. Each metric is rated against Google's thresholds below.
| Metric | Good | Needs improvement | Poor |
|---|---|---|---|
| LCP (loading) | ≤ 2.5 s | 2.5–4.0 s | > 4.0 s |
| INP (interactivity) | ≤ 200 ms | 200–500 ms | > 500 ms |
| CLS (visual stability) | ≤ 0.1 | 0.1–0.25 | > 0.25 |
| FCP (first paint) | ≤ 1.8 s | 1.8–3.0 s | > 3.0 s |
| TTFB (server response) | ≤ 800 ms | 800–1800 ms | > 1800 ms |
LCP, INP, and CLS are the three Core Web Vitals Google uses. FCP and TTFB are supporting diagnostics that usually explain a poor LCP. Live is a single sample on the current device and connection. Treat it as a fast directional read rather than the number Google scores the page on.
CrUX
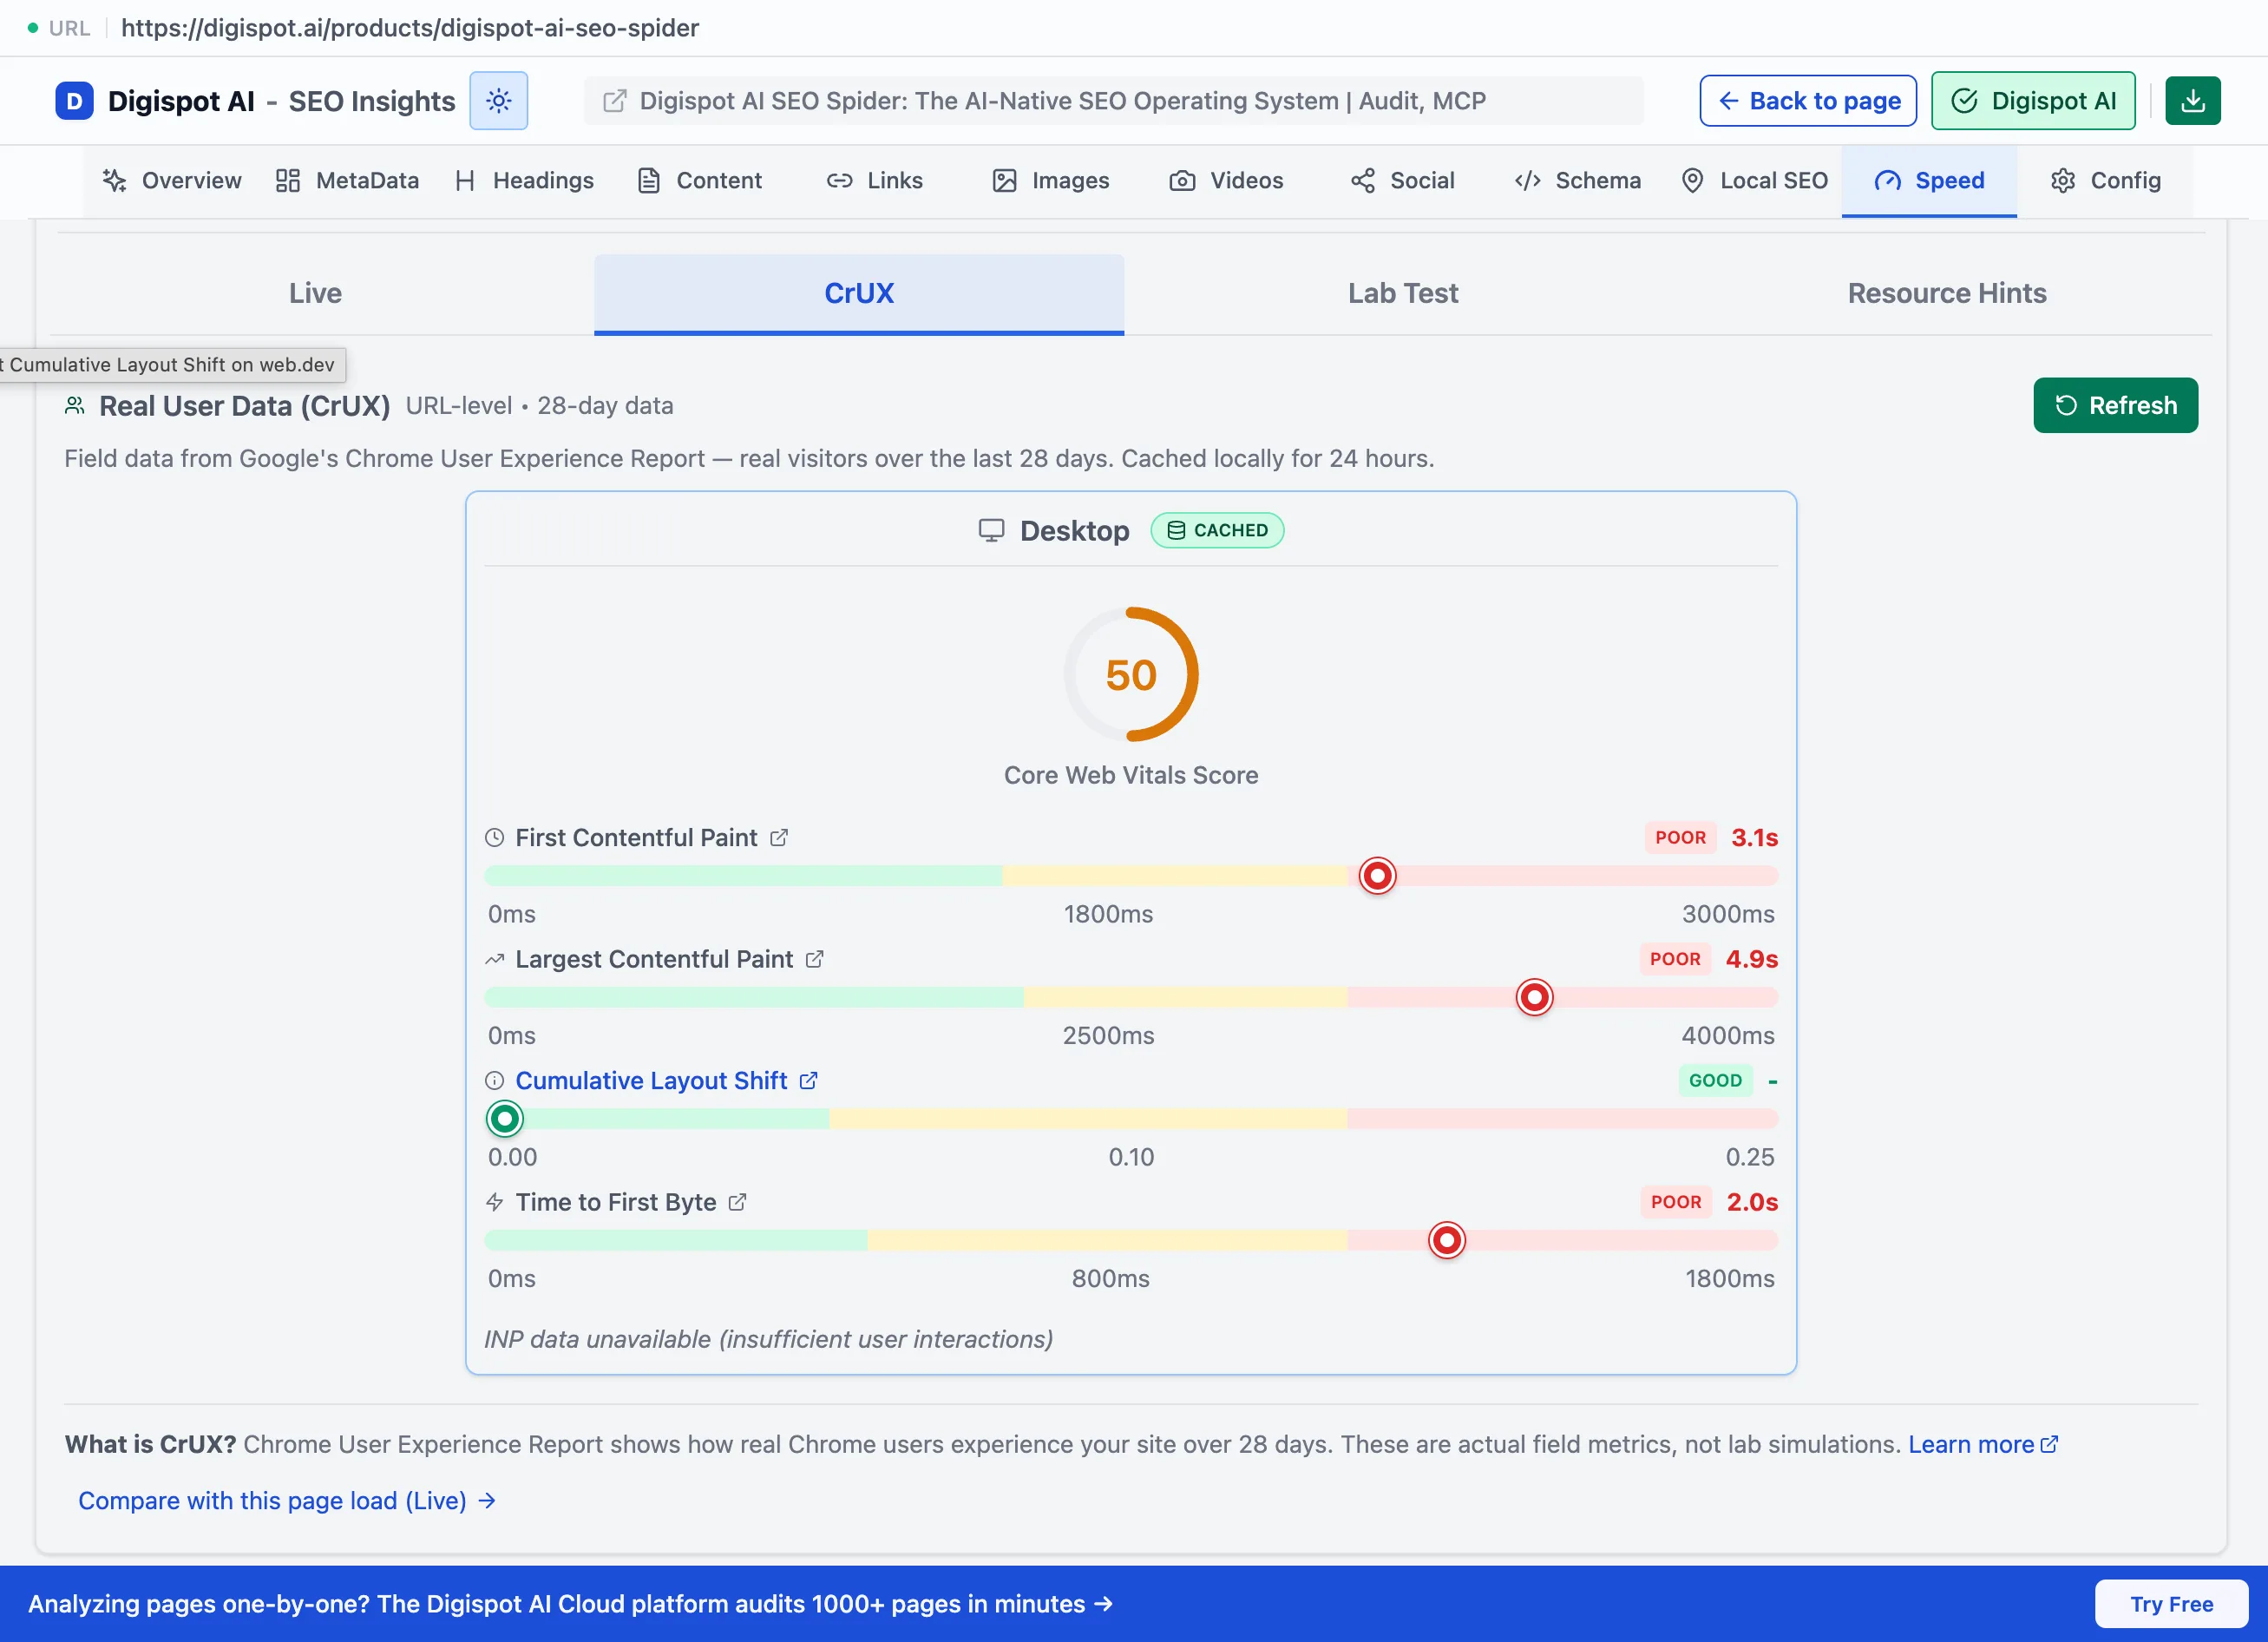
The CrUX sub-tab shows real-user field data (28-day, 75th-percentile) for mobile and desktop, drawn from the Chrome User Experience Report. This is the closest view to what Google actually scores, because it reflects real visitors on real devices rather than one test. It requires a connected Digispot account. See Managed AI.
Lab test
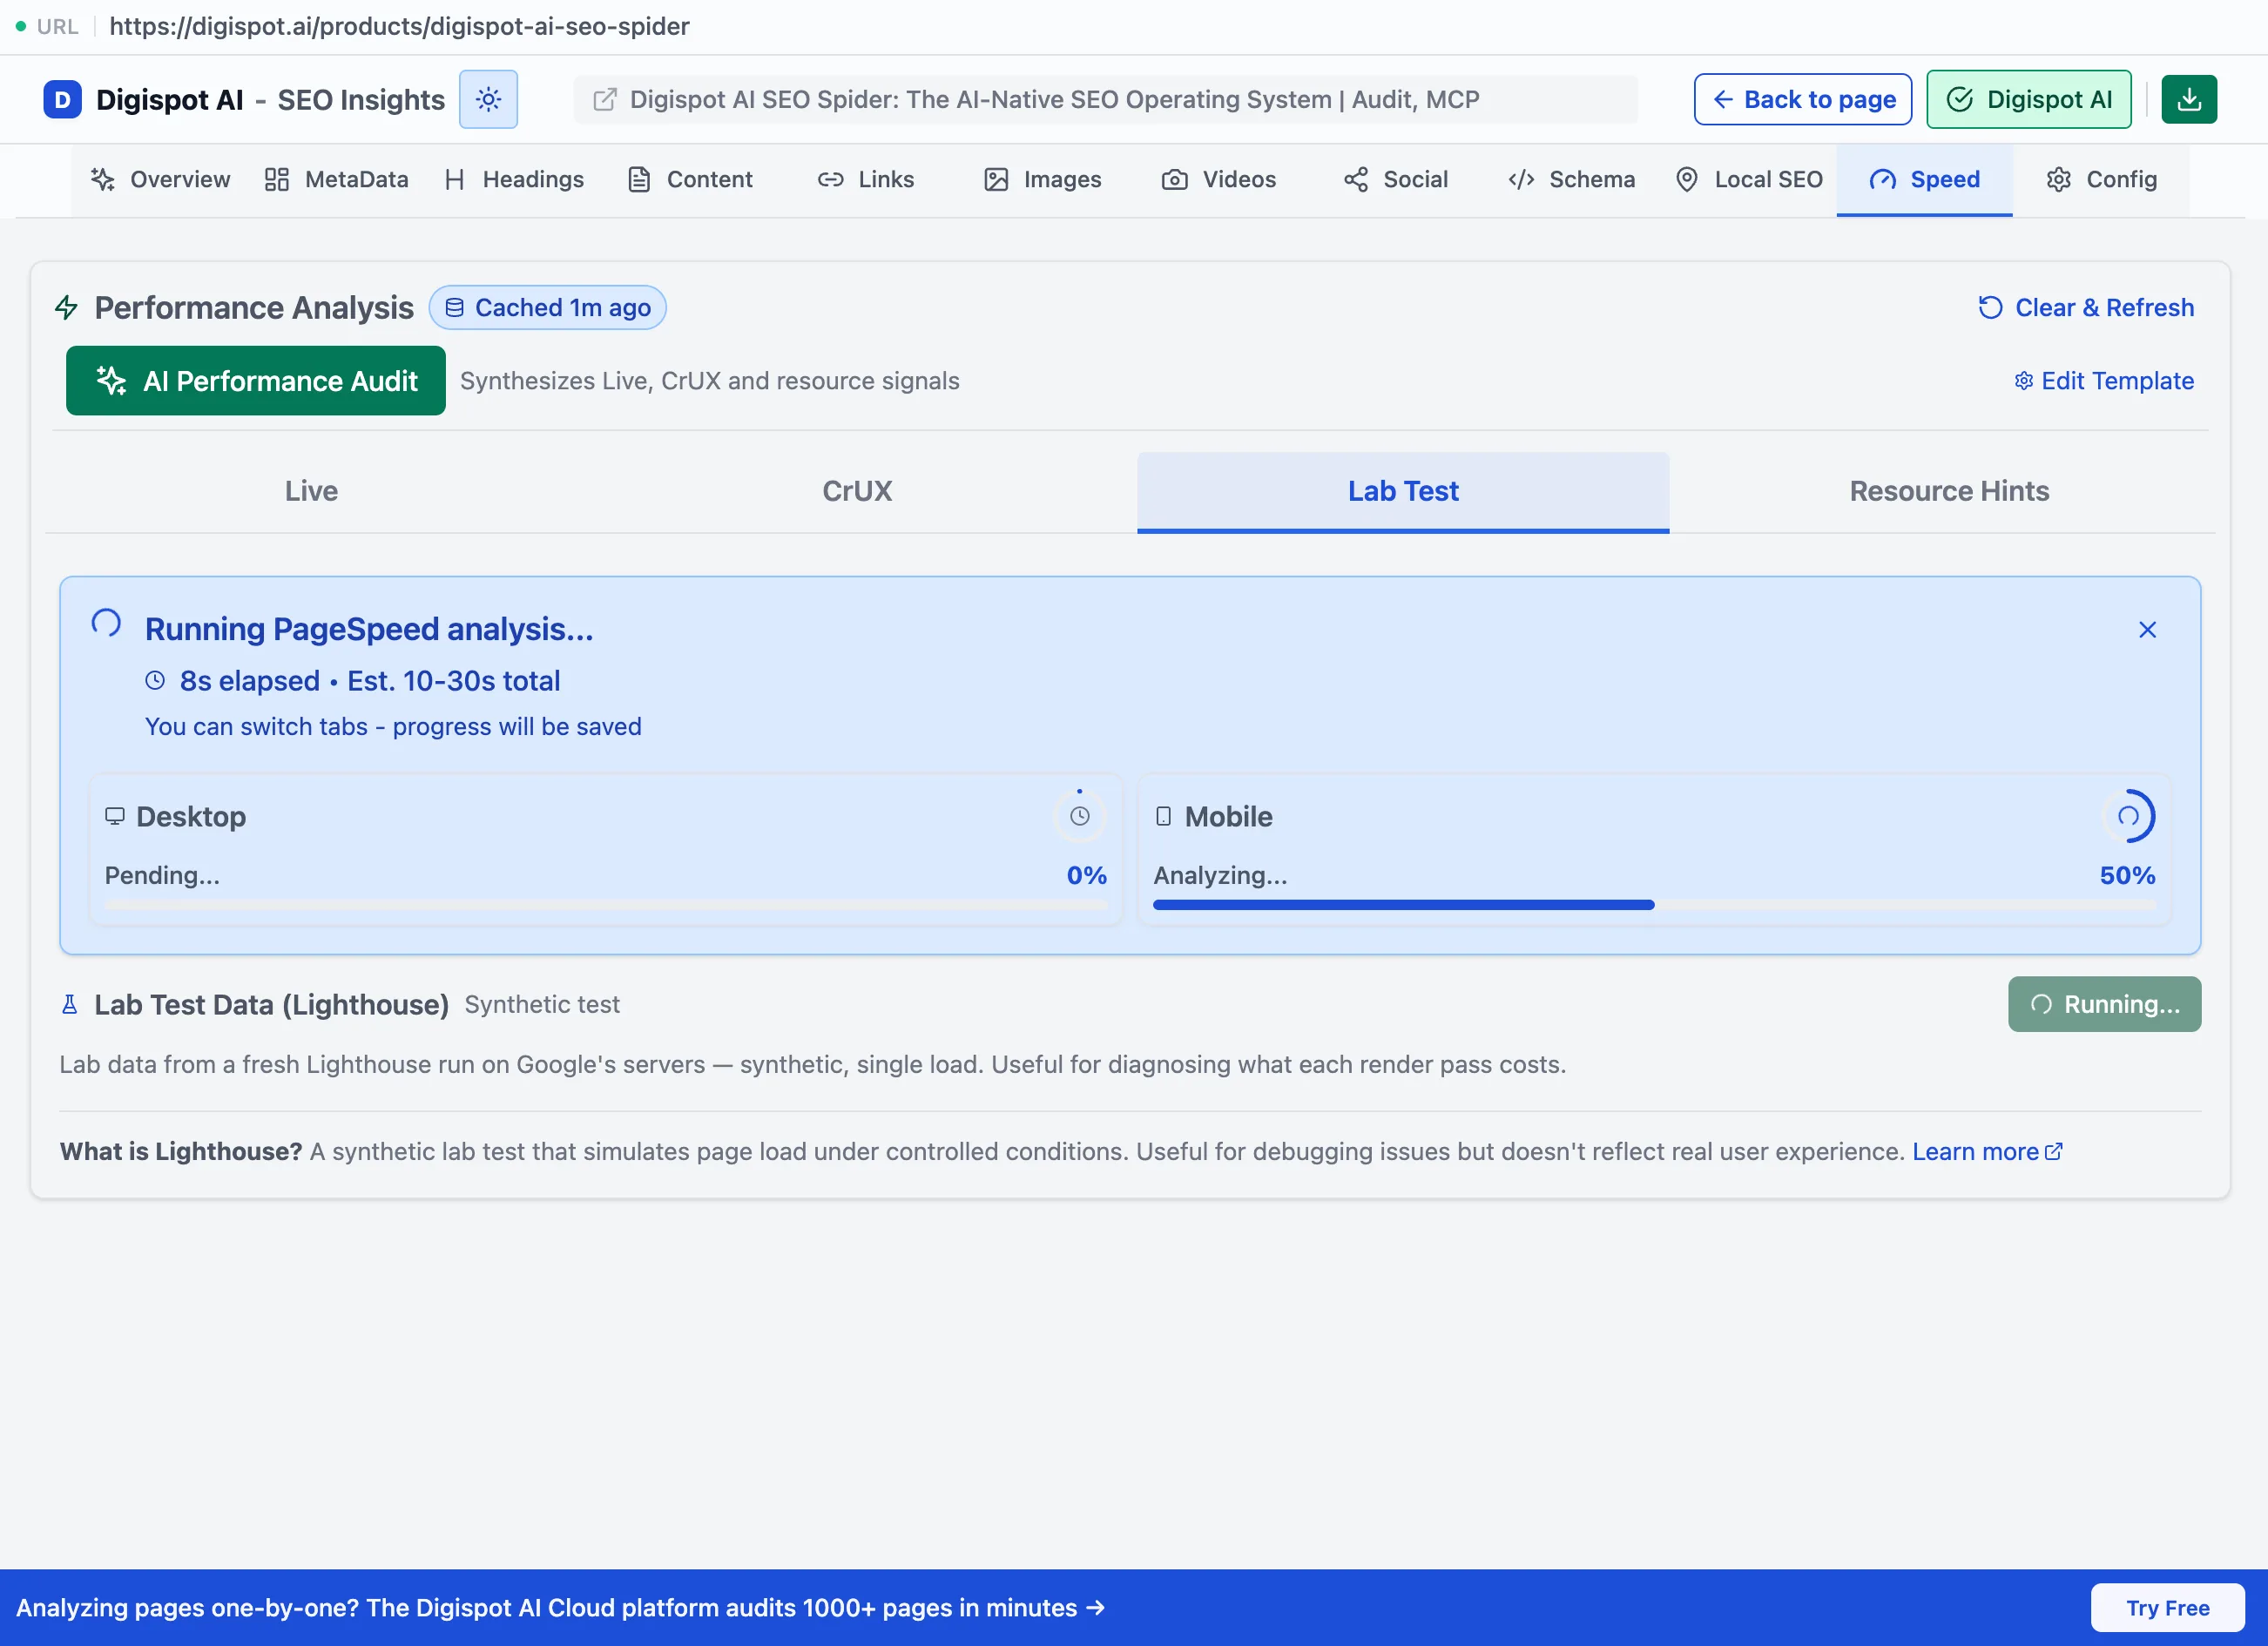
The Lab test sub-tab runs a Lighthouse test through PageSpeed Insights. It returns mobile and desktop performance scores with the full metric set. Lab data is reproducible and useful for debugging a fix. Lighthouse simulates a throttled mid-range mobile device. A low mobile score next to a high desktop score usually reflects the simulated conditions, not two broken pages. Lab test also requires a connected Digispot account.
Resource hints
The Resource hints sub-tab scans the page's HTML, with no external call, for the hints that speed up resource loading. It also adds a script analysis and performance insights.
preload: fetches a critical resource (a hero image or font) early to improve LCPpreconnect: opens a connection to a third-party origin ahead of needdns-prefetch: resolves a third-party domain's DNS earlyprefetch: fetches a resource likely needed on the next navigation
The script analysis flags render-blocking and heavy third-party scripts. These are the usual cause of a poor INP or a delayed LCP.
When Live and CrUX disagree, trust CrUX. An example is a fast Live LCP against a slower CrUX mobile LCP. CrUX is the p75 of real users over 28 days. Live is one sample on the current machine.
INP replaced FID as a Core Web Vital in March 2024. Older tools may still show FID; INP is the metric Google now uses for responsiveness.