
Site report
The Site report covers site-wide signals — health score, robots.txt, sitemaps, security, and llms.txt.
The Site report covers the signals that apply to the whole site rather than a
single page. These are the foundations that shape how every URL is discovered,
trusted, and served. A problem here rarely shows on one page in isolation, which is
why it earns its own report: a blocking robots.txt rule or an expired certificate
suppresses the entire crawl at once.
Site visualizer
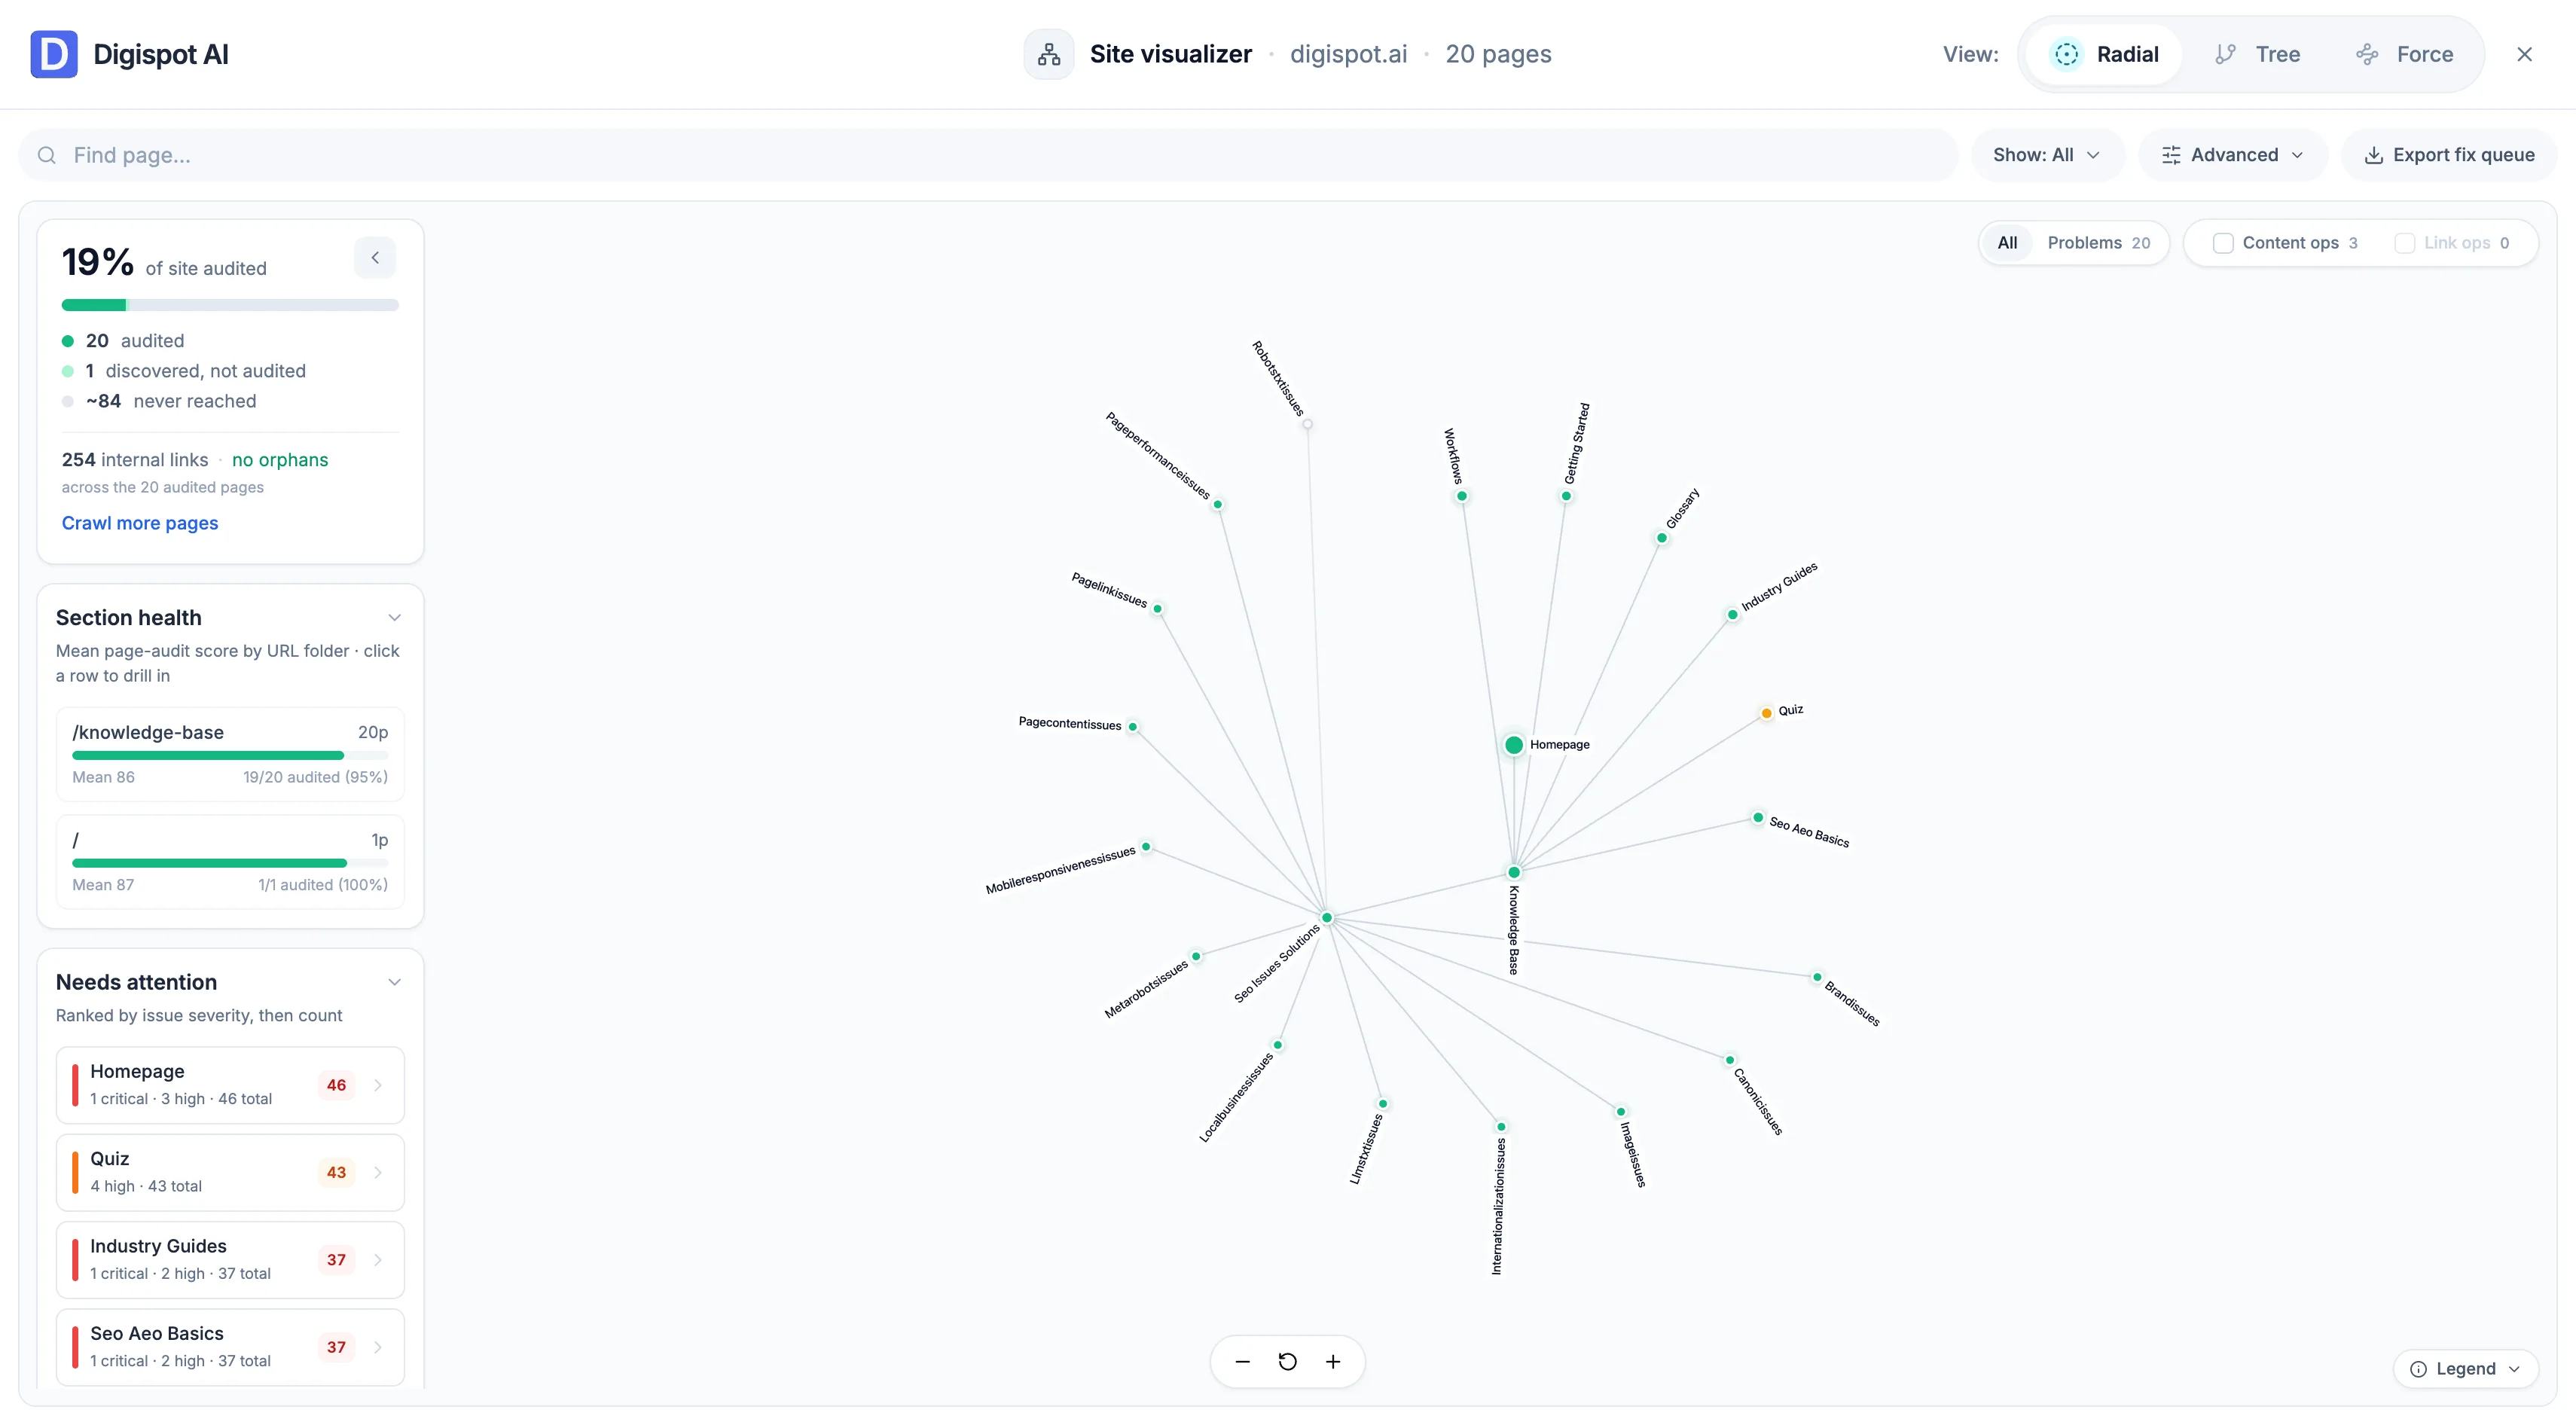
The report opens with the Site visualizer, an interactive graph of the crawled site. The homepage sits at the center and pages radiate out along their internal links, in a Radial, Tree, or Force layout. Node colour flags status, so pages with problems stand out from the rest.
A side rail reads the graph as numbers:
- Coverage — the share of the site audited, with the counts of pages audited, discovered but not audited, and never reached
- Internal links — the total across audited pages, and the orphan count
- Section health — the mean page-audit score per URL folder, clickable to drill in
- Needs attention — pages ranked by issue severity, most critical first
Filter the graph to Problems, Content ops, or Links, search for a page, and use Export fix queue to send the flagged pages out as a worklist.
Health tiles
Summary tiles give the site-wide read at a glance: the site health score plus the status of the four foundations below it: robots.txt, sitemap, security, and llms.txt. Each tile is a jump-off point into its detail panel.
Detail panels
Each foundation has a dedicated panel that moves from a status summary into the underlying rules and records.
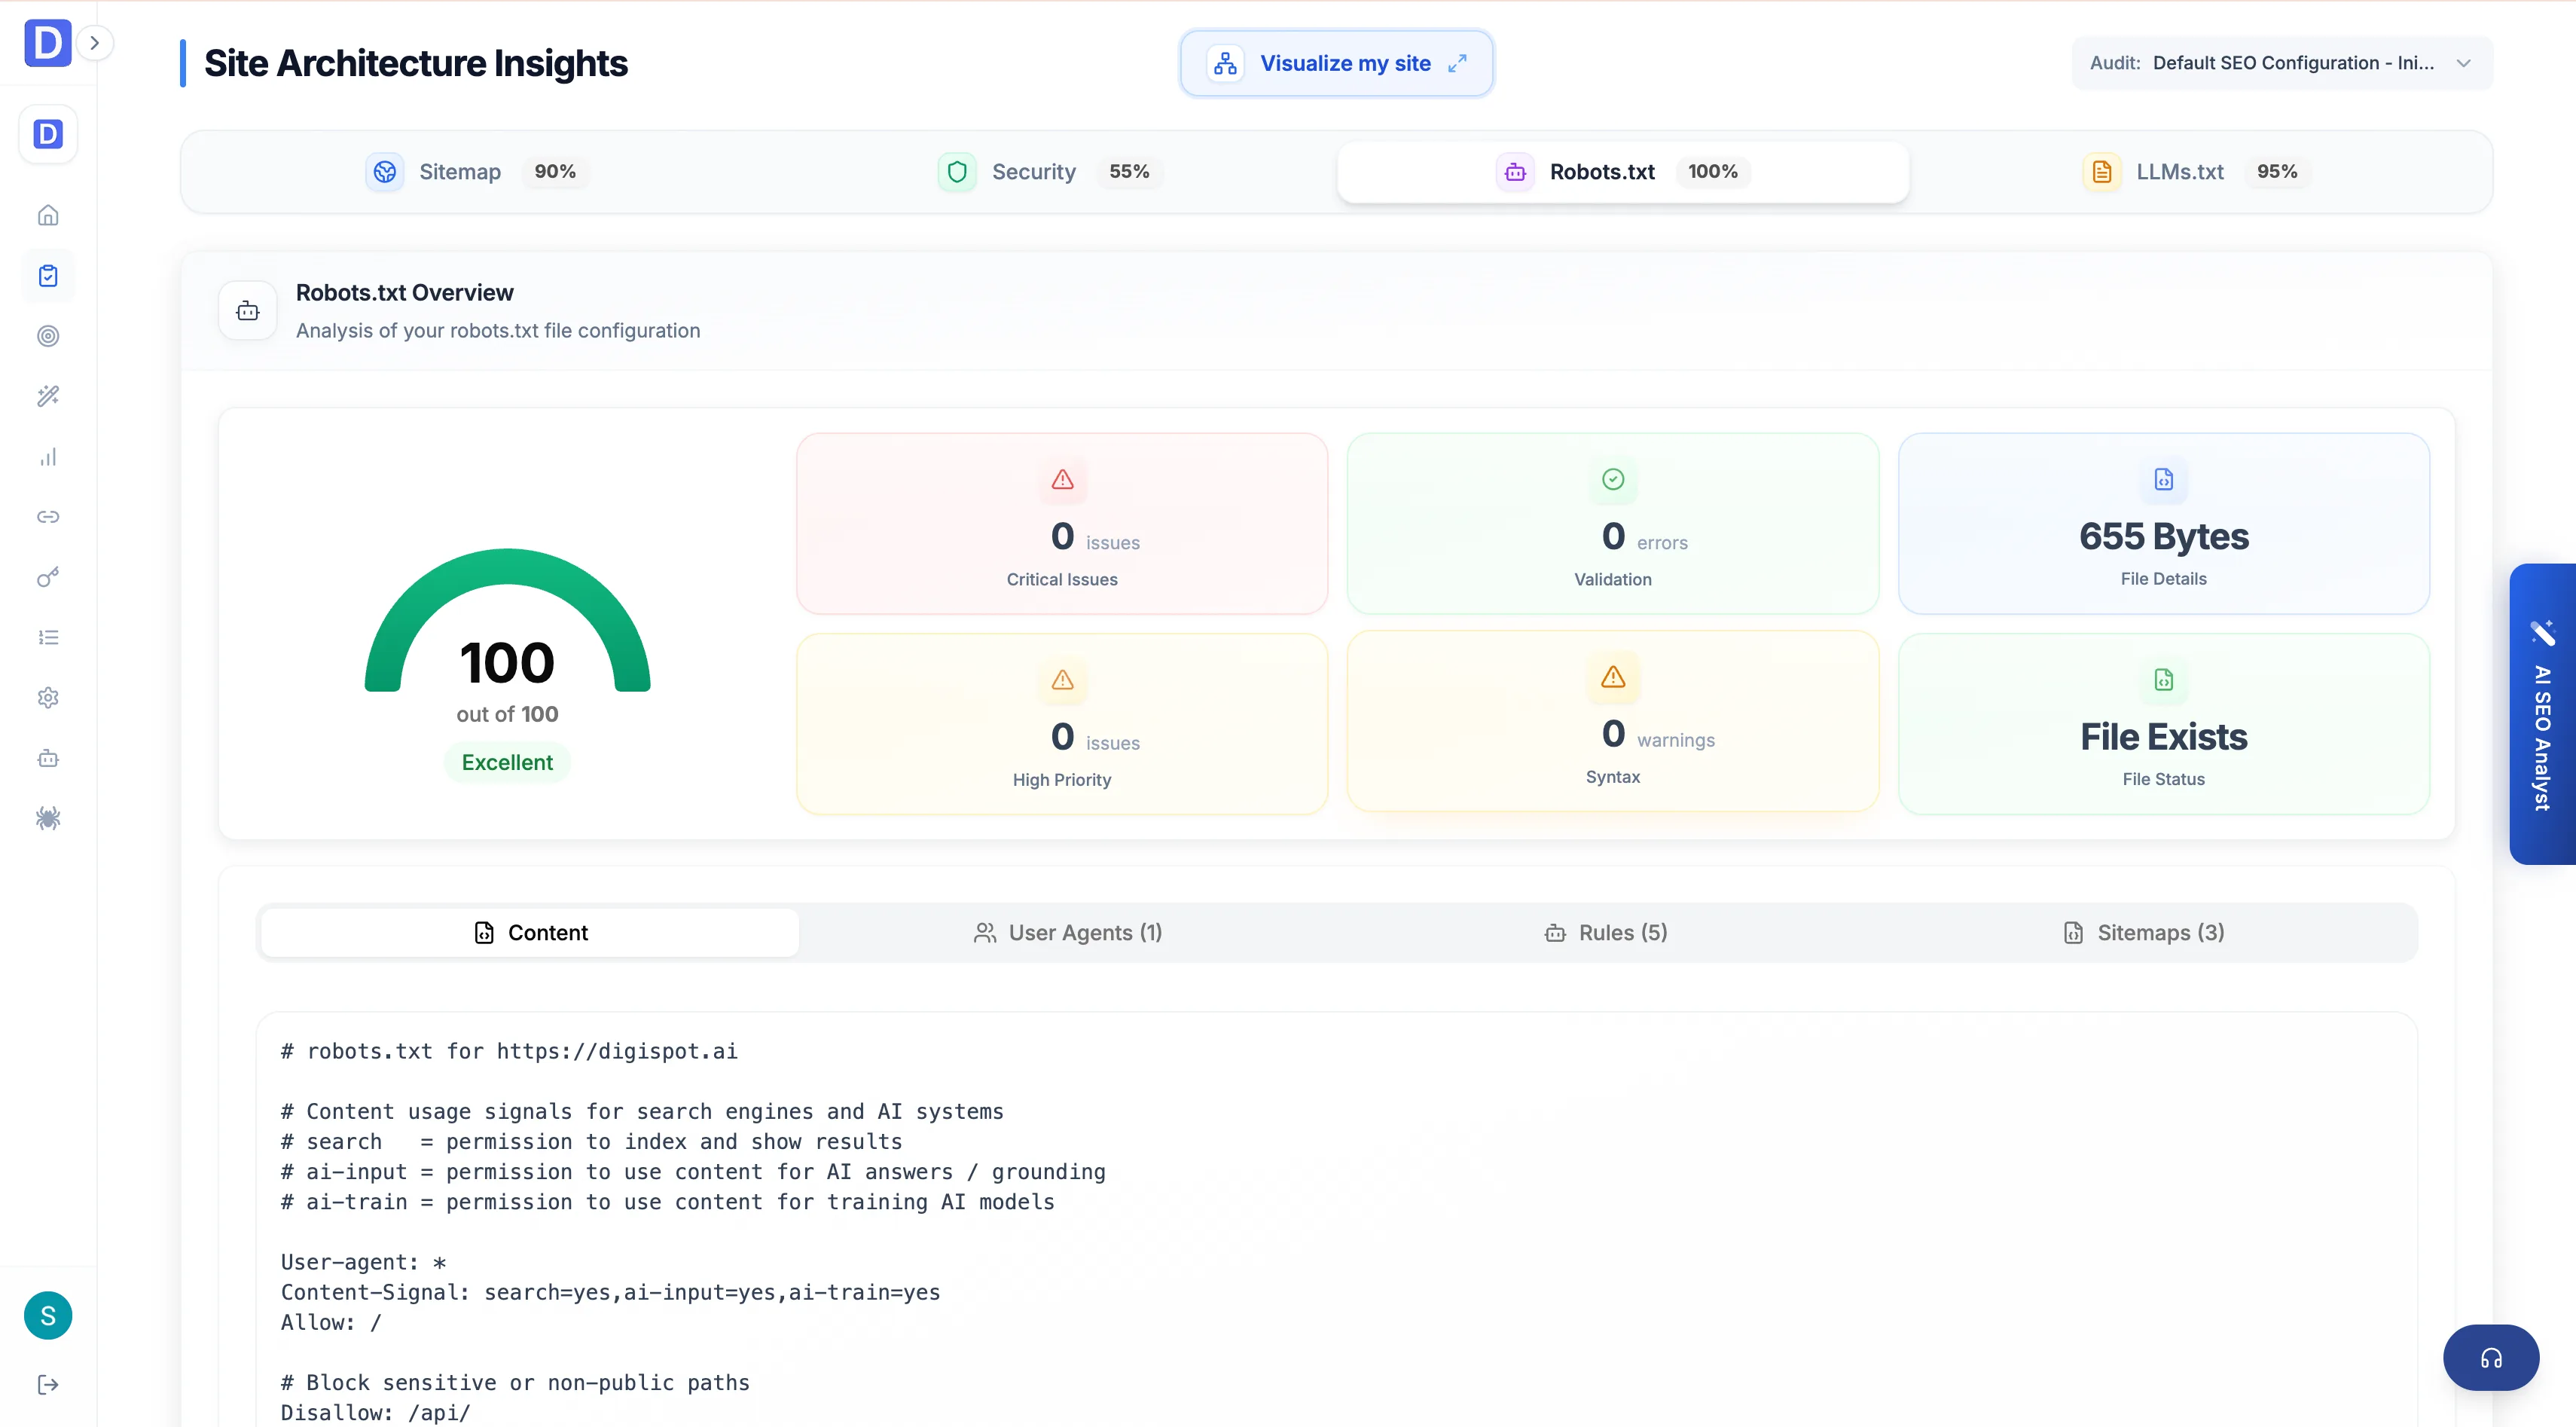
Robots.txt
Presence and the crawl rules it declares — which user agents are allowed or disallowed, and the sitemap references it points to.
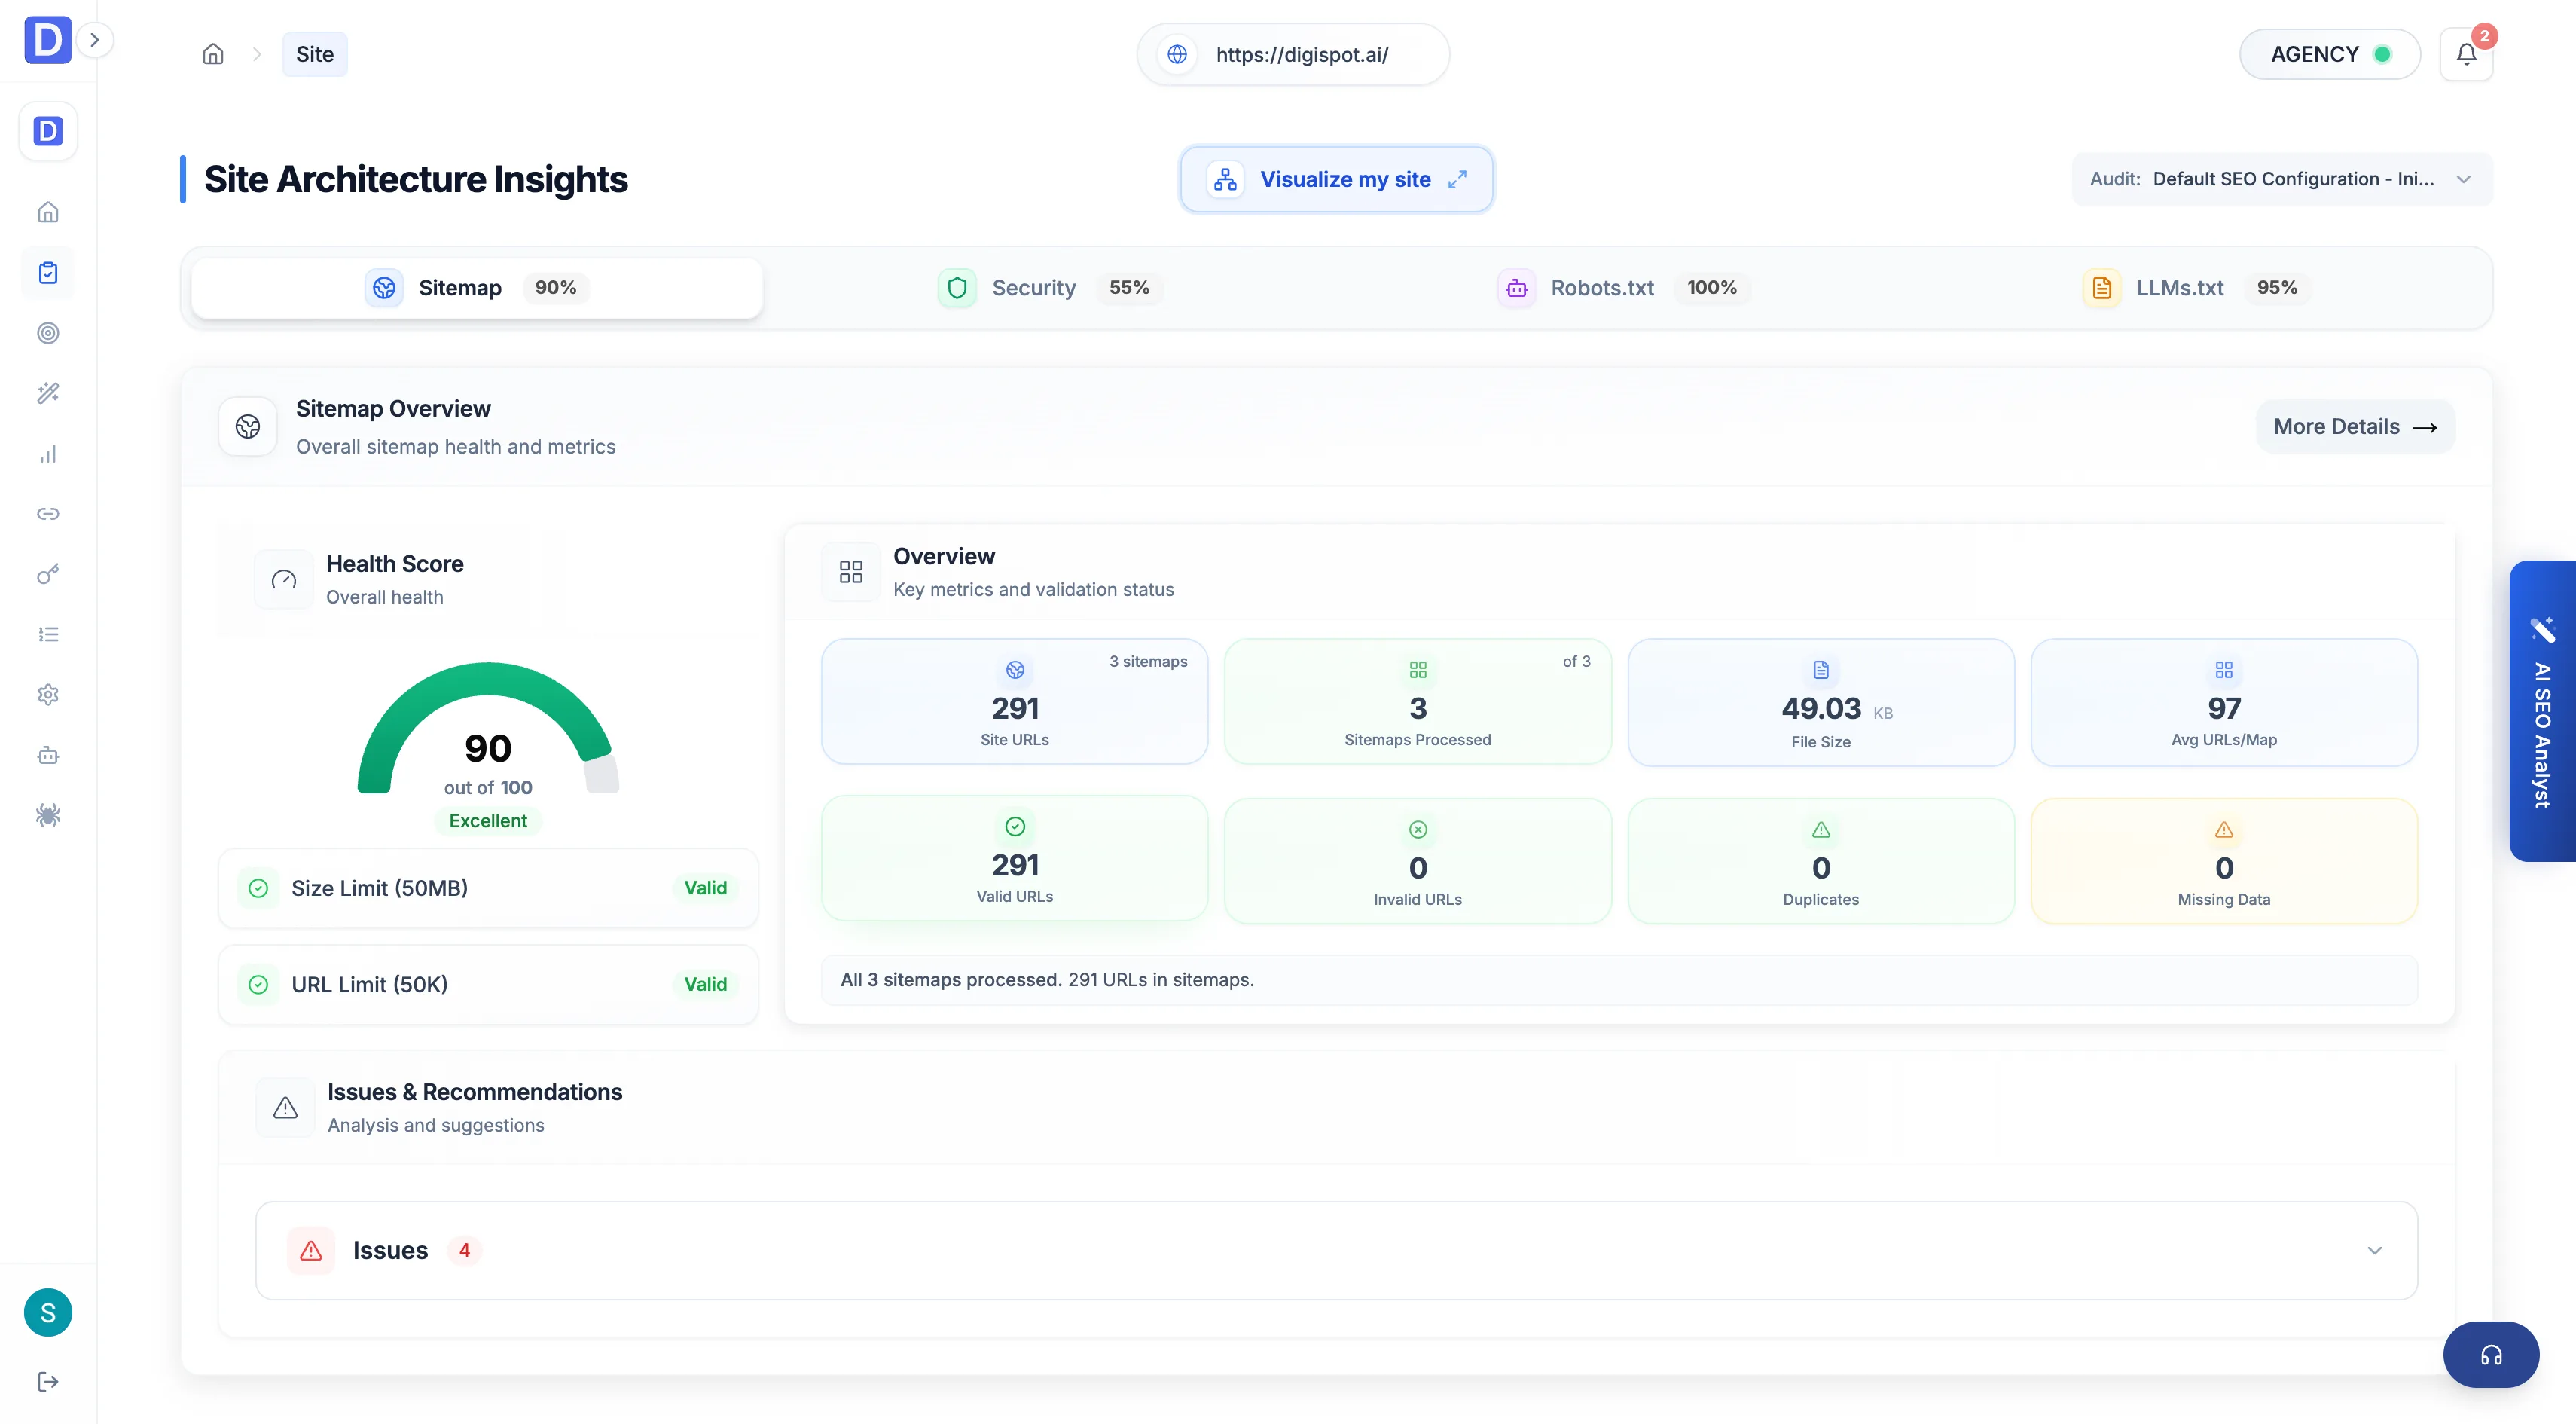
Sitemaps
Sitemaps processed, valid and invalid URLs, average URLs per map, section count, duplicates, internal and external links, and link-text quality. Drilling into a single sitemap opens overall-health, content, and URL-structure analysis.
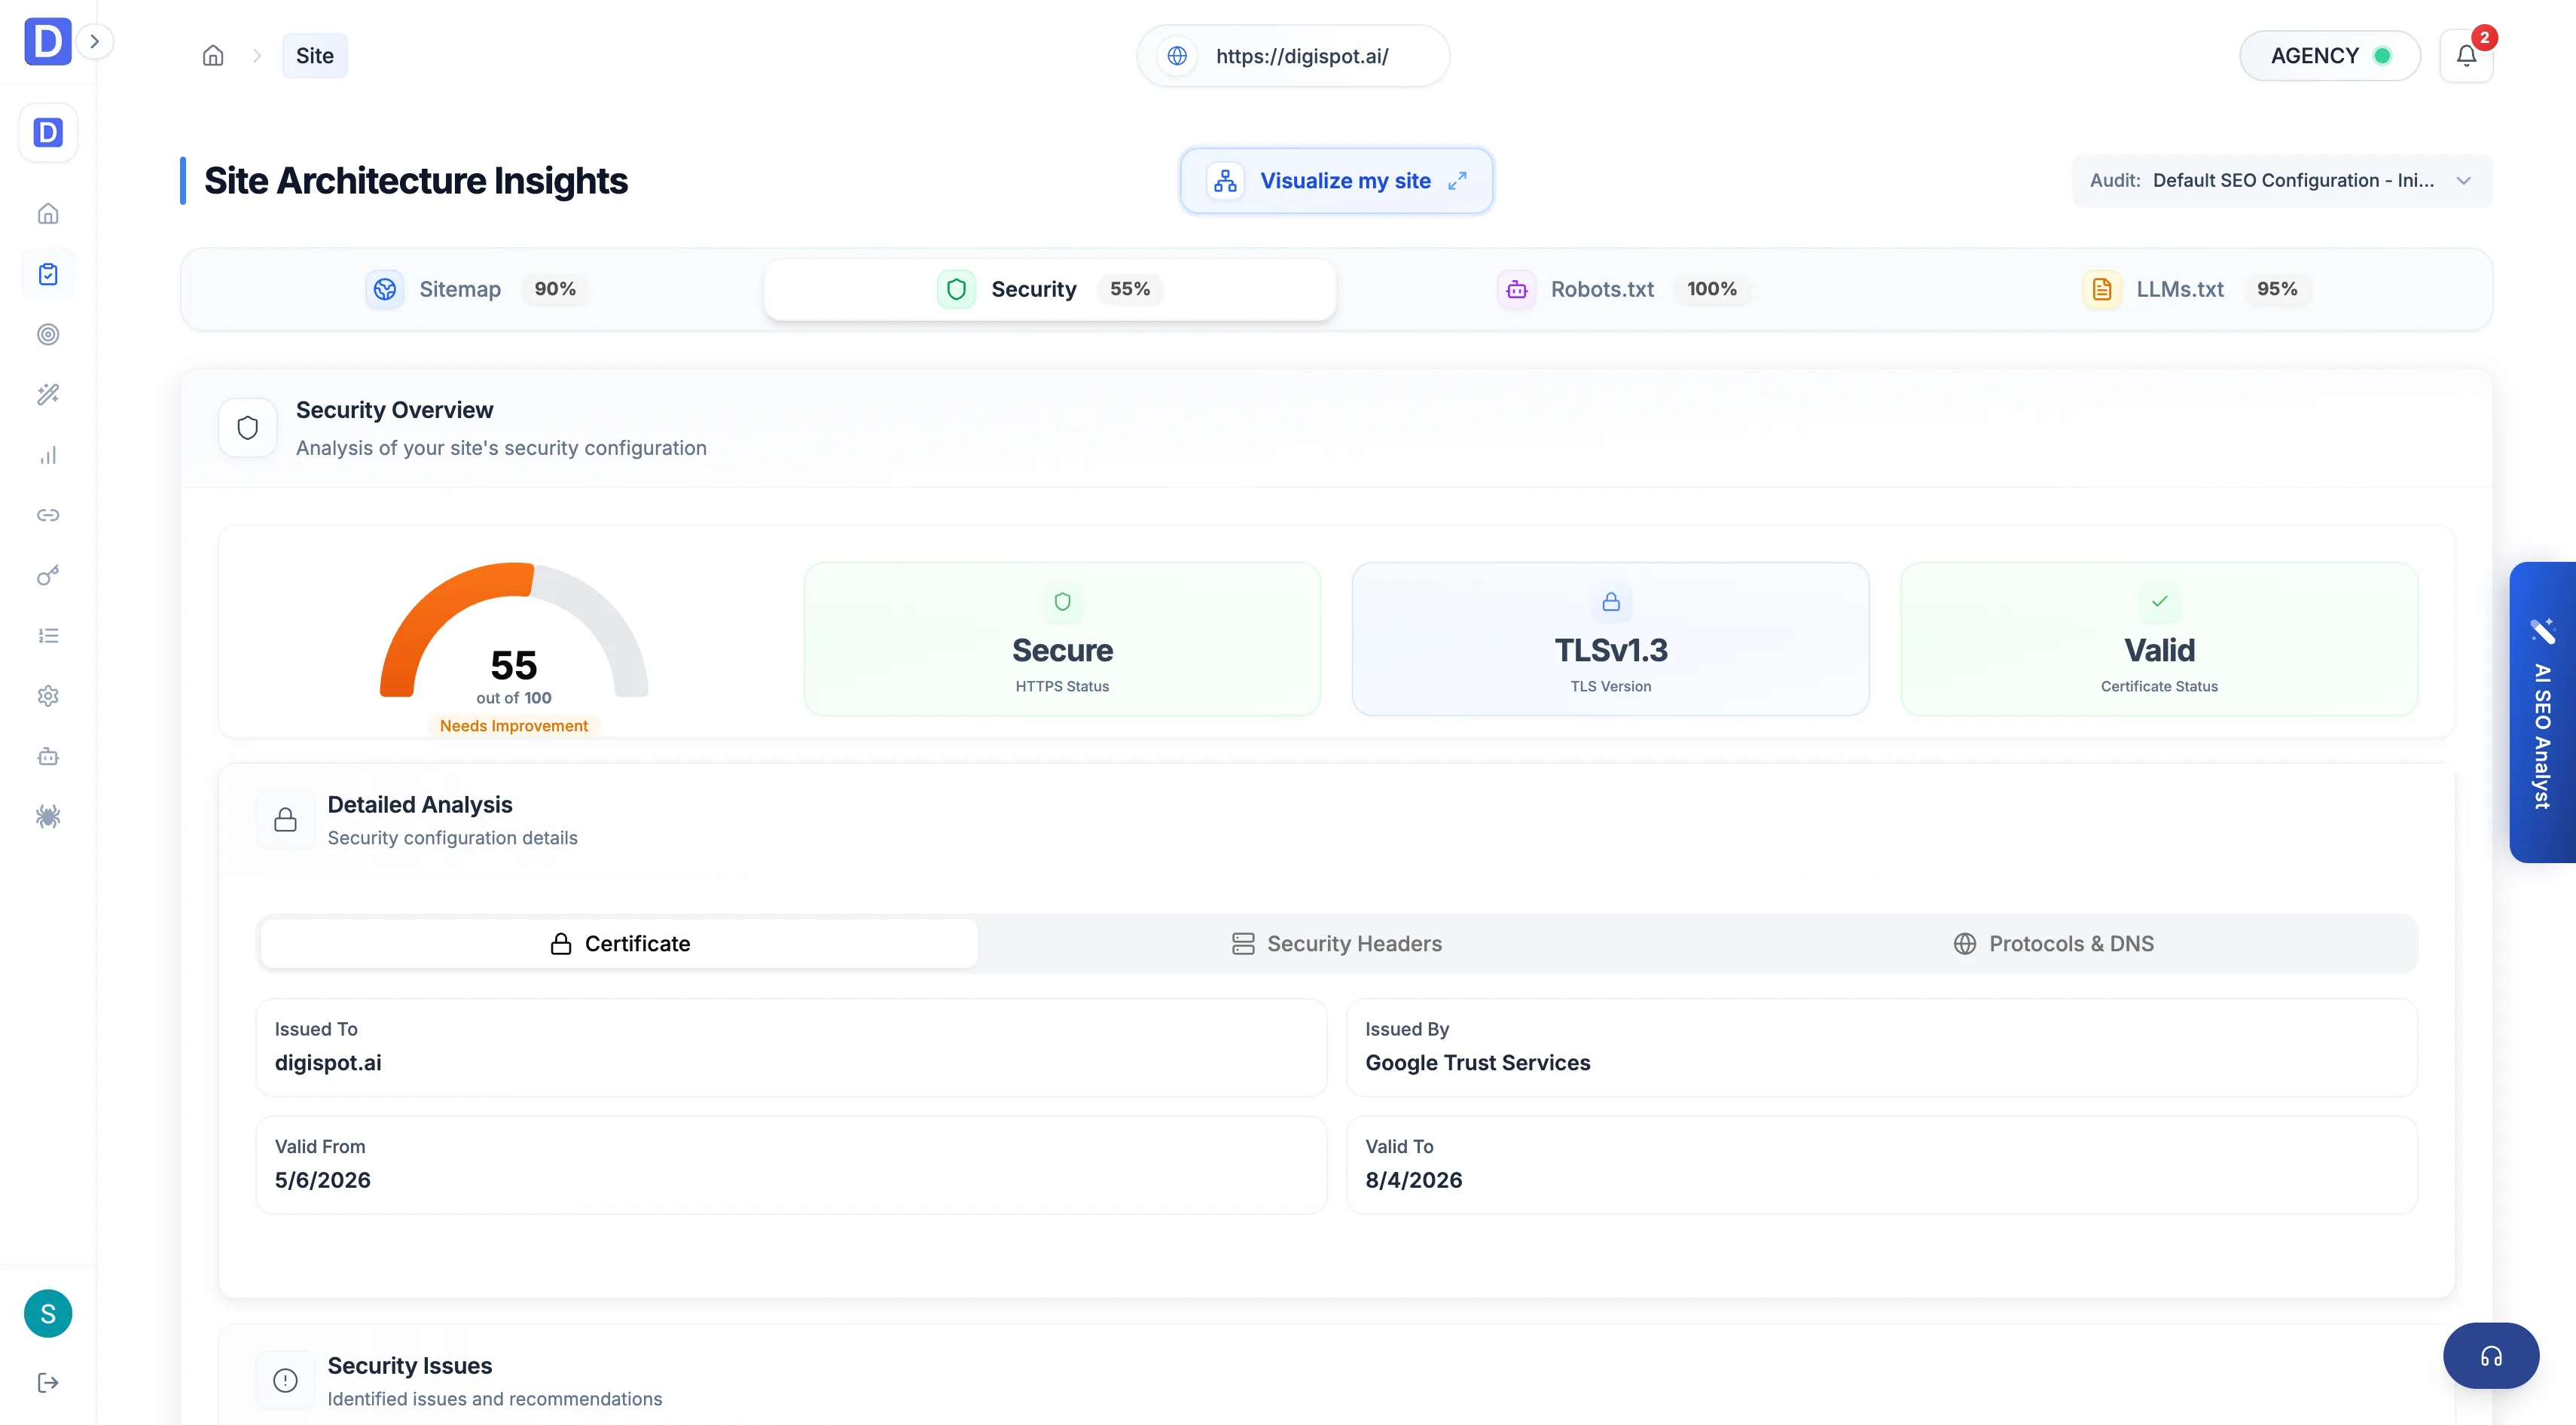
Site security
Certificate status, HTTPS, TLS version, HTTP/2 and HTTP/3 support, DNSSEC, CAA records, and the certificate issuer and validity dates.
llms.txt
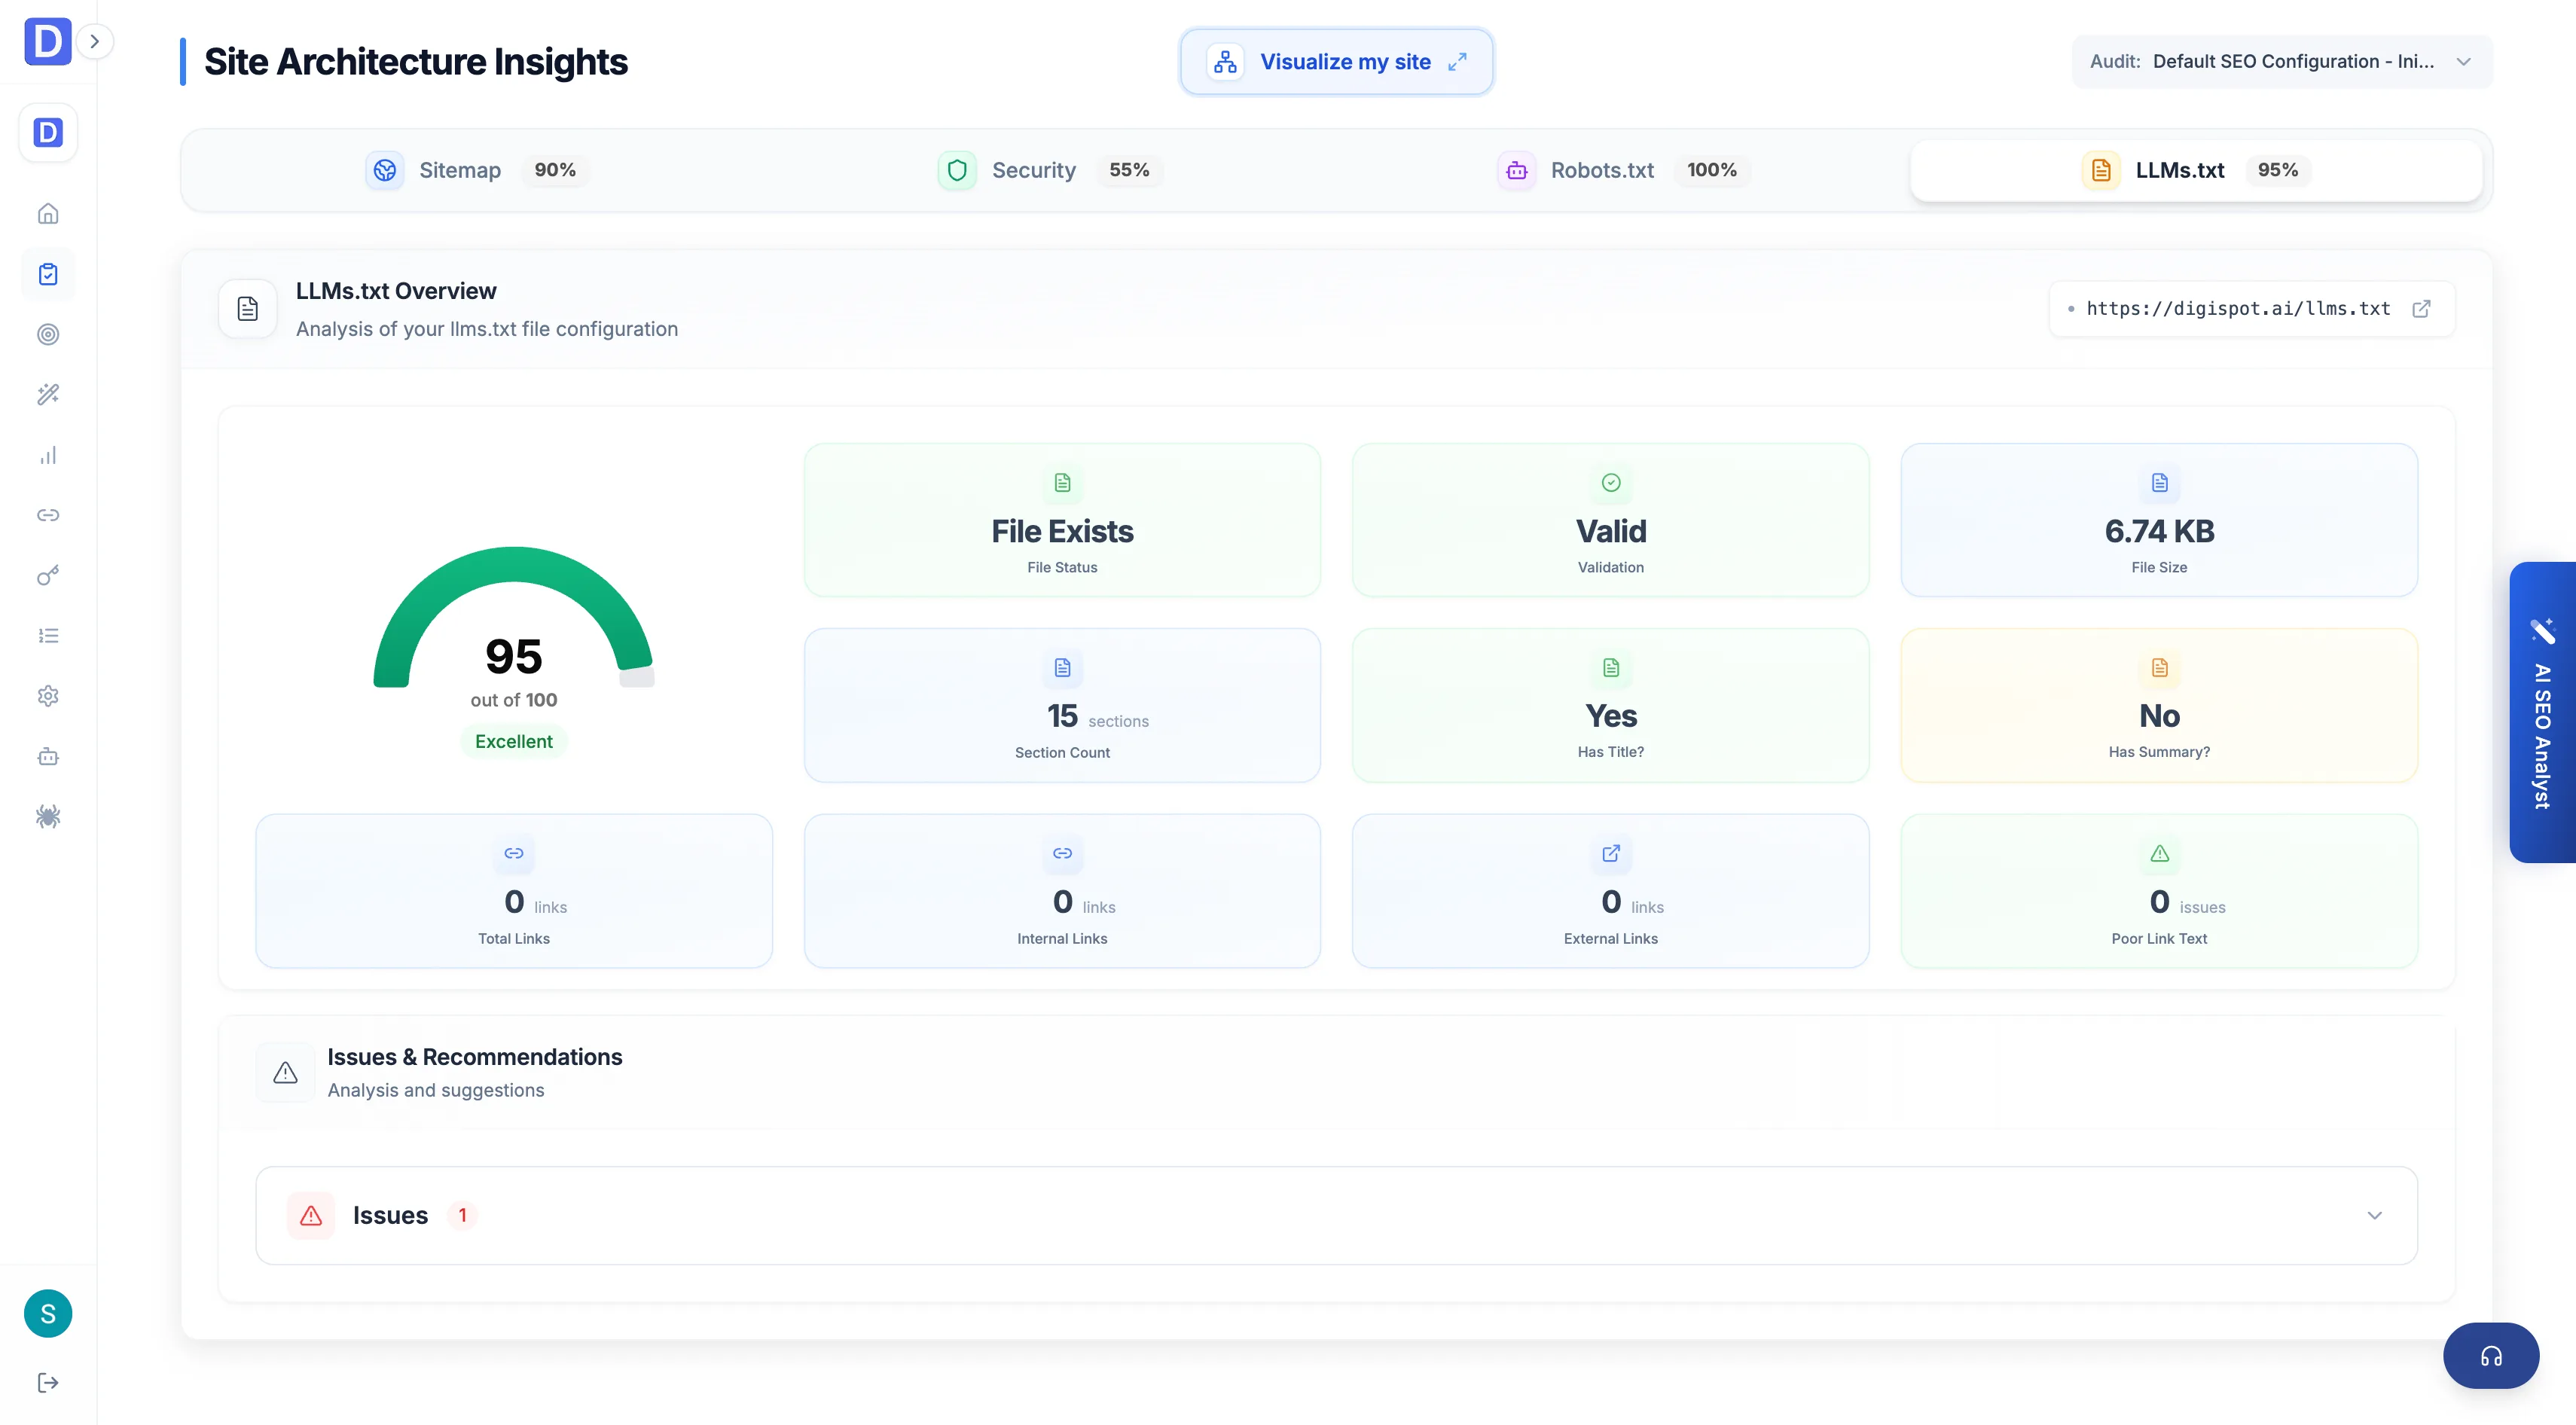
Presence and rules for the emerging file that guides AI crawlers to the content worth citing. It carries its own score and metrics.
Security findings gate more than the padlock icon. An invalid or expired certificate, or a downgrade off HTTPS, undermines trust signals across every page the audit scored. Treat it as a site-wide blocker, not a cosmetic warning.
AI insight
A Summarize with AI insight turns the raw site signals into a plain-language health summary, calling out which foundation is weakest and what to address first.