Dashboard
The dashboard is the platform's home — a site-wide view of health, search performance, traffic, and the actions worth taking next.
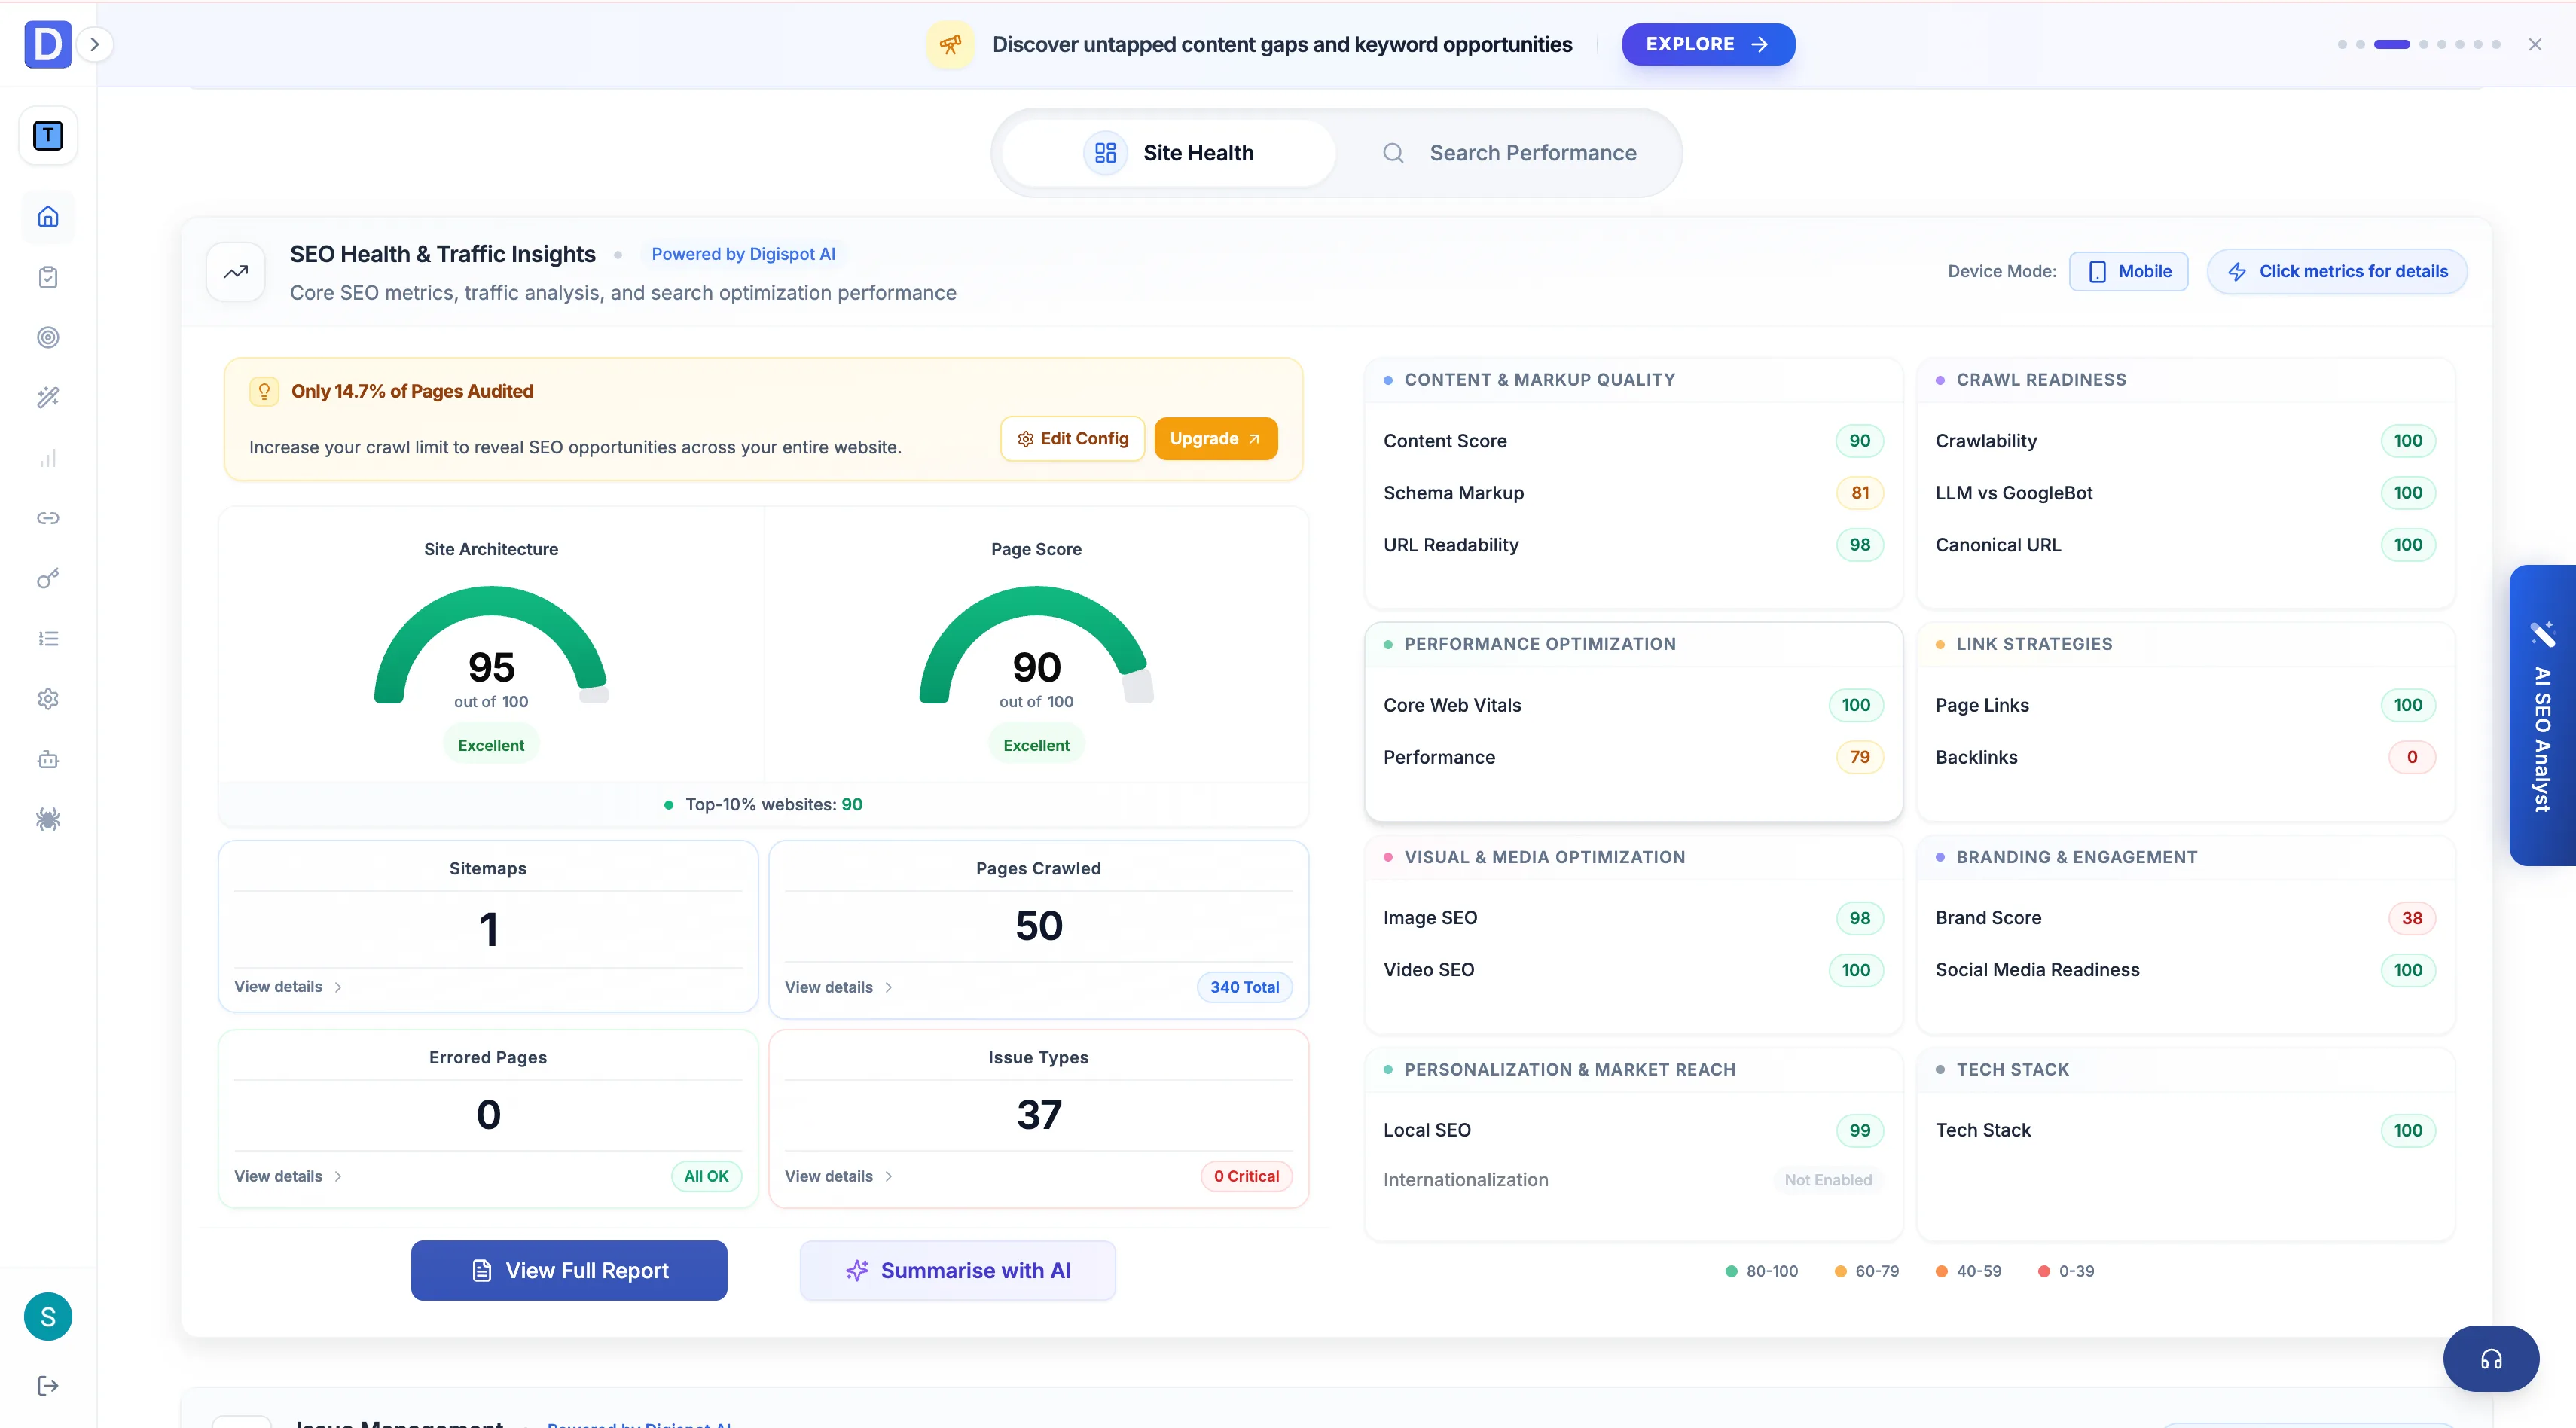
The dashboard is the first screen after signing in. It is a site-wide view that pulls the latest audit run together with connected Google data. The framing is around what to do next rather than raw numbers. It scopes to the active project. A run-status banner at the top tracks any audit in progress and refreshes the widgets when it completes.
The dashboard needs at least one completed audit run to populate. A fresh project shows onboarding states prompting a first crawl; the search and traffic widgets additionally require Google Search Console and GA4 to be connected.
Metrics and performance
The upper widgets summarize where the site stands.
- Top-level metrics — site health, page score, and headline search performance
- Business performance and CXO analytics — higher-level roll-ups framed for reporting rather than debugging
- Traffic & engagement — users and sessions by device, a traffic-source breakdown, and Search Console clicks, impressions, CTR, and position
Actions and warnings
The action-oriented widgets turn findings into a worklist.
- Top actions — the issues worth fixing first, each tagged Critical, Quick win, or Easy fix so effort and impact are visible at a glance
- Warnings breakdown — findings grouped by category and severity
- Team performance — activity across the workspace's members
- A notification center for run completions and alerts
AI analysis
A Website health summary runs across the dashboard. An AI analysis panel breaks the site down by crawlability, content quality, brand presence, content gaps, keyword data, backlinks, and international SEO. Each dimension gets a plain-language read rather than a score alone.
Start each session at the Top actions strip. It's already ranked by leverage, so the Critical and Quick-win items are the shortest path from the dashboard to a measurable gain. Drill into a category only when an action needs context.