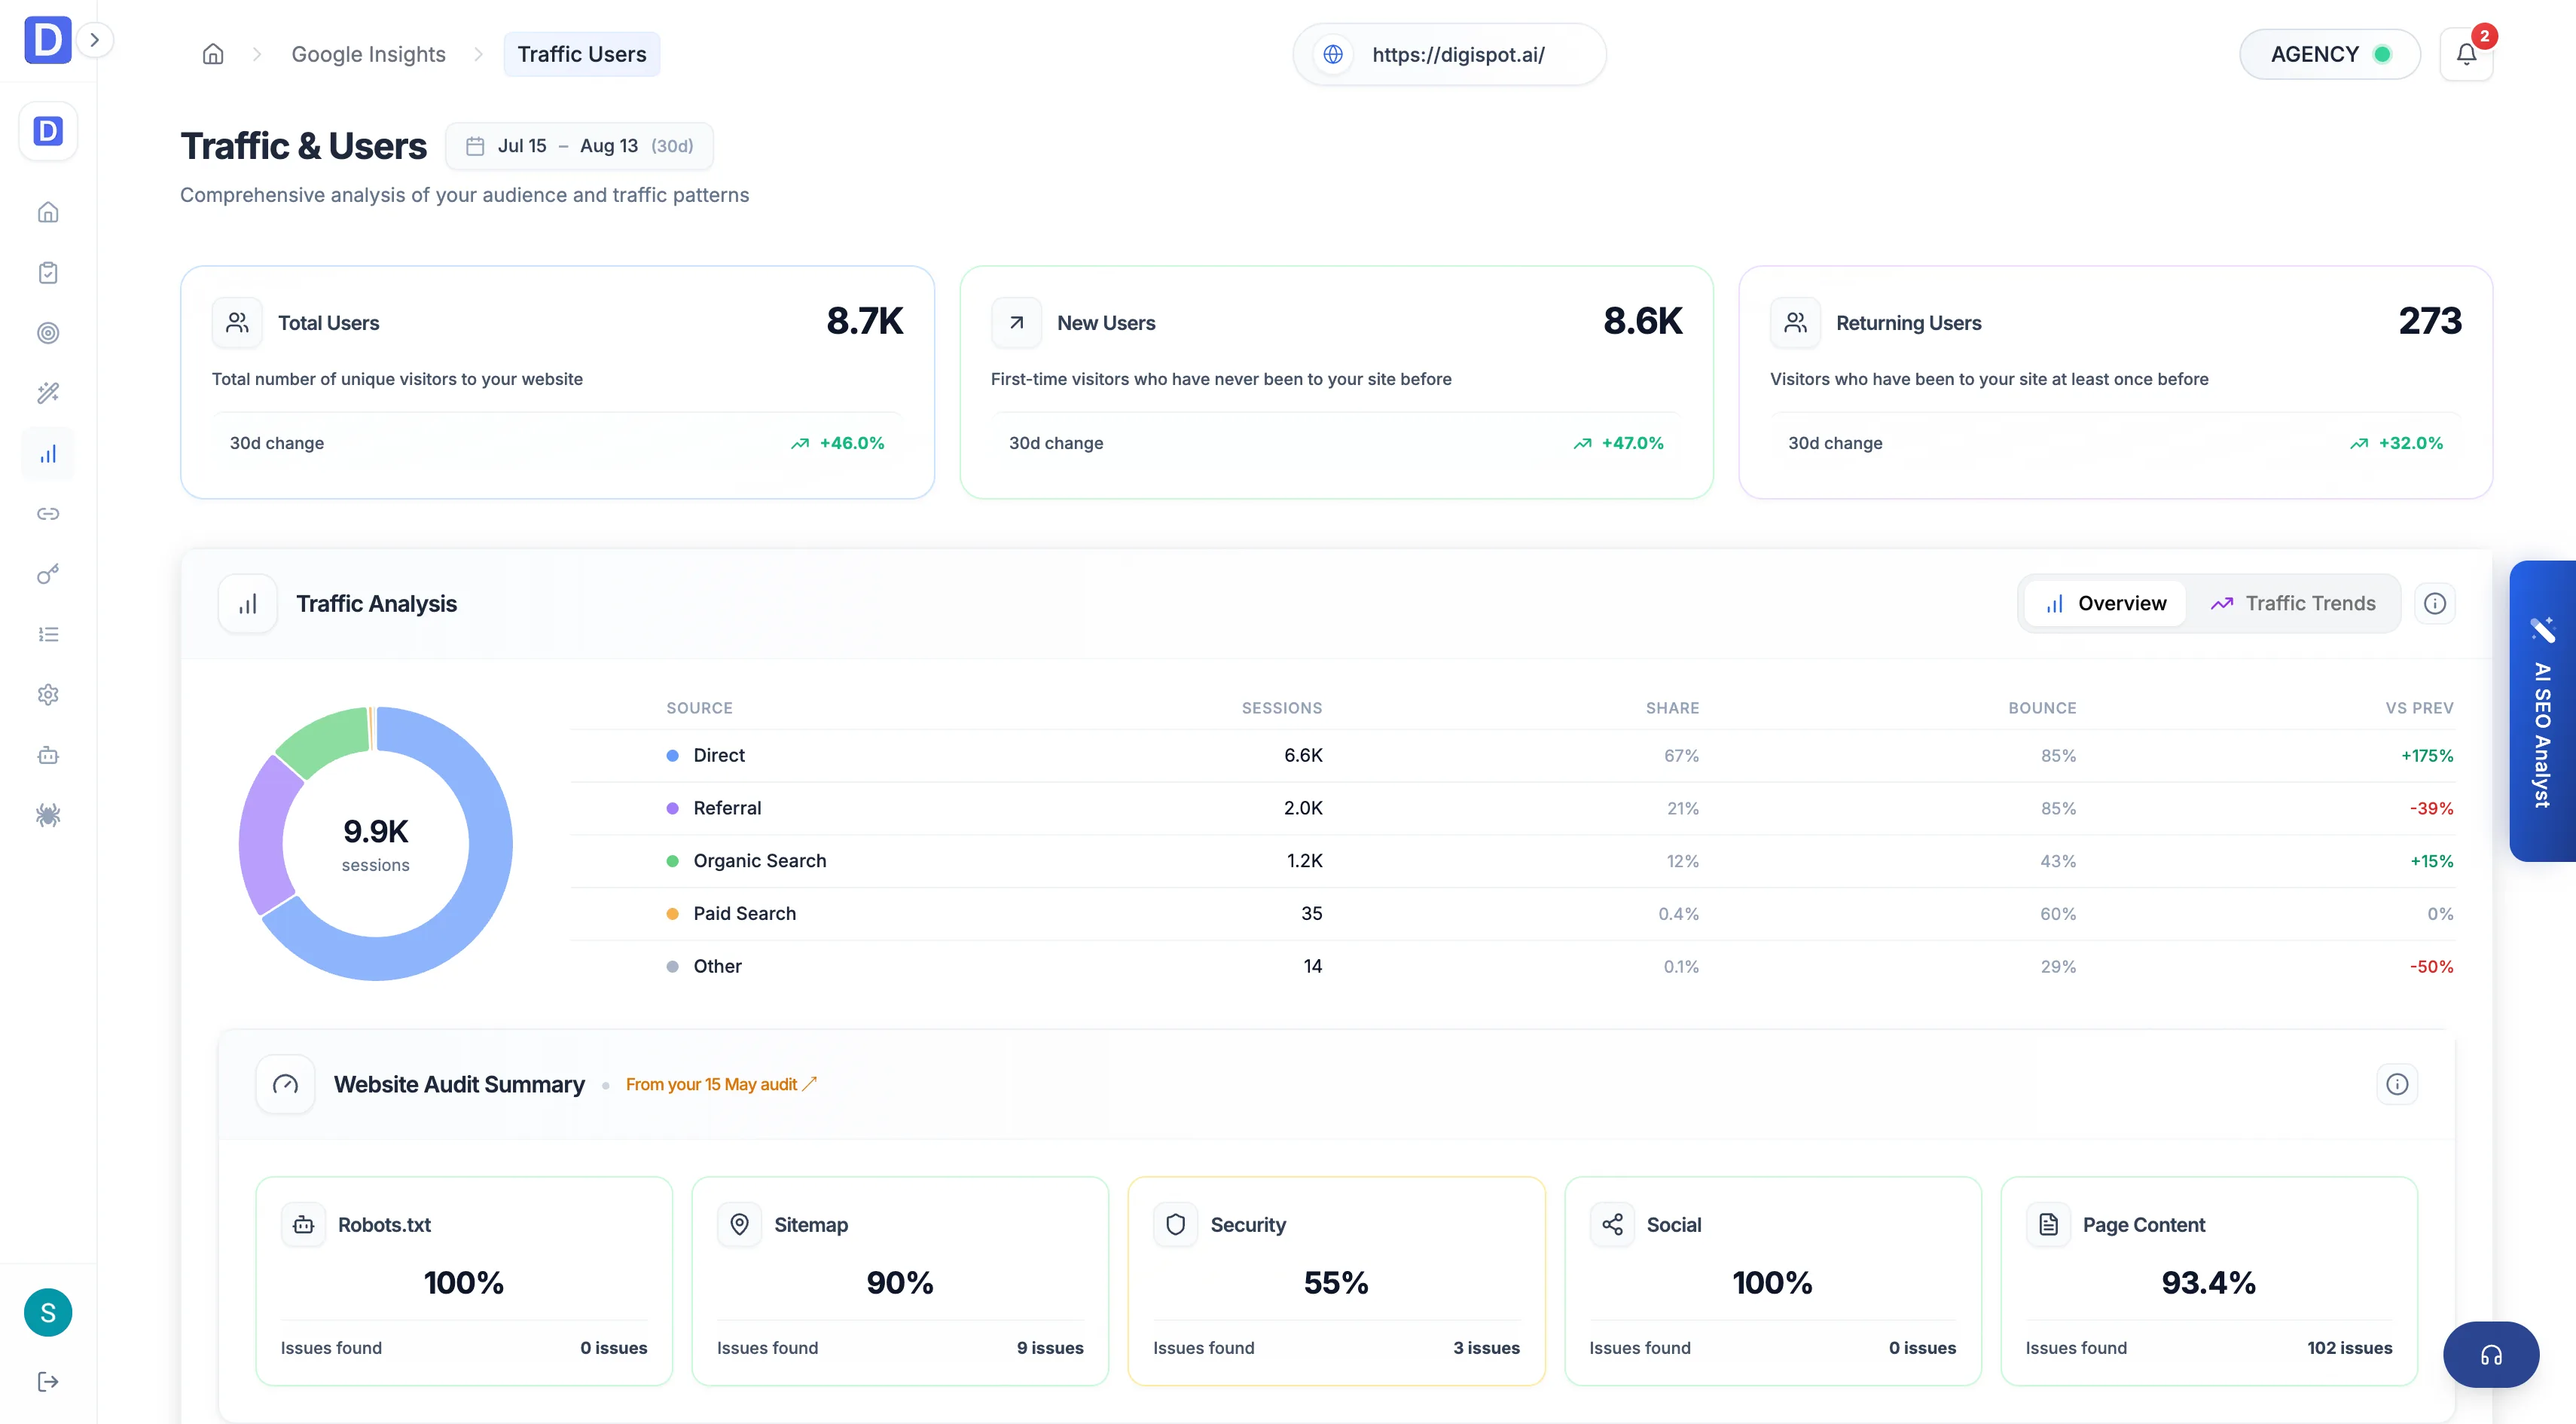
Traffic & Users
The Traffic & Users view covers GA4 audience and engagement — sources, devices, bounce rate, and geography.
The Traffic & Users view is the GA4 side of Google Insights. It covers who visits, where they come from, and how they engage once they arrive. Where Search Performance shows how the site earns visibility in Google, this view shows what happens after the click: audience size, channel mix, and device behavior.
This view is Google Analytics 4-scoped. Its widgets fill in only after GA4 is connected and has synced data for the project; until then they show an empty or connect state rather than an error.
User analytics overview
The first section sizes and segments the audience.
- Total users, new users, and returning users, each with its trend
- The balance of new versus returning as a read on whether the site is acquiring or retaining
Traffic sources
The second section attributes visits to the channels that produced them.
- Traffic by source and channel — organic, direct, referral, and the rest
- Trends per source, so a shift in the mix is visible over time
Device performance
The third section splits engagement by device, since mobile and desktop visitors rarely behave the same.
- Mobile, desktop, and tablet sessions
- Bounce rate and average session duration per device
- The mobile-versus-desktop gap — where one device engages markedly worse than the other
A high mobile bounce rate against a healthy desktop rate usually points at a page-experience problem — layout, speed, or intrusive interstitials on small screens — rather than a content problem. Cross-check the affected pages in the Performance audit.